
Authors:
Heather L. Merk, The Ohio State University; Hamid Ashrafi, University of California, Davis; David Douches, Michigan State University; Trudi Grant, The Ohio State University; Christine Hackett, The James Hutton Institute; David Harry, Oregon State University; Nancy Huarachi, The Ohio State University; Jennifer Kling, Oregon State University; Deana Namuth-Covert, University of Nebraska, Lincoln; Matthew Robbins, The Ohio State University; Allen Van Deynze, University of California, Davis; Nicholas Wheeler, Oregon State University; Scott Wolfe, The Ohio State University; Kelly Zarka, Michigan State University; David Francis, The Ohio State University
Information Flow
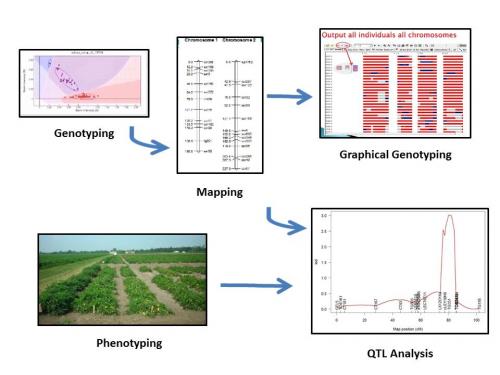
Figure 1. Flow of information from collecting genotypic and phenotypic data to mapping to graphical genotyping and quantitative trait locus analysis. Image credits: Genotyping, Allen Van Deynze, UC Davis; Mapping, Scott Wolfe, The Ohio State University; Graphical Genotyping, Nancy Huarachi, The Ohio State University; Phenotyping, David Francis, The Ohio State University; QTL Analysis, Hamid Ashrafi, UC Davis.
Learning Modules
Tutorials
Phenotyping
Genotyping
Mapping
Graphical Genotyping
QTL Analysis
Case Studies
Funding Statement
Development of this lesson was supported in part by the National Institute of Food and Agriculture (NIFA) Solanaceae Coordinated Agricultural Project, agreement 2009-85606-05673, administered by Michigan State University. Any opinions, findings, conclusions, or recommendations expressed in this publication are those of the author(s) and do not necessarily reflect the view of the United States Department of Agriculture.
Mention of specific companies is not intended for promotional purposes.
PBGworks 1346