
Authors:
David M. Francis, The Ohio State University; Heather L. Merk, The Ohio State University; Deana Namuth-Covert, University of Nebraska-Lincoln; Matthew Robbins, The Ohio State University
Lesson Objectives
In this lesson you will follow an example of how molecular tools are incorporated into strategies to improve plants. Applied to the task of plant improvement, and you will learn about steps taken to meet the following overall plant breeding goals to improve disease resistance:
- Identify resistance
- Develop suitable populations to introgress resistance from a donor and identify markers associated with resistance
- Develop suitable populations to confirm associations between markers and resistance
- Develop improved germplasm that combines multiple traits using phenotypic selection and selection based on molecular markers
- Combine multiple loci for resistance to bacterial diseases using molecular markers (gene pyramiding)
This lesson is written to address the continuing education needs of practicing plant breeders, advanced undergraduate students, and graduate students. After completing this lesson, you should be able to:
- Identify information resources about previously identified genes to meet specific plant breeding goals, specifically improvement of disease resistance
- Develop a strategy for determining the inheritance of a particular trait
- Describe how linkage between DNA-based molecular markers and a trait of interest is identified
- Explain how marker-assisted selection aids the breeding process, including forward selection, background selection, and gene pyramiding
Identifying Resistance
Background
Bacterial Spot causes yield loss in tomato through reduced photosynthetic capacity and defoliation. Fruit quality is reduced indirectly due to sun-scald and directly by bacterial lesions. Bacterial spot of tomato is caused by as many as four species of Xanthomonas, including Xanthomonas euvesicatoria, X. vesicatoria, X. perforans, and X. gardneri (reviewed by Jones et al., 2004). In addition, at least five physiological races—T1–T5—are recognized on the basis of a hypersensitive (HR) reaction on a differential series of host genotypes (reviewed by Robbins et al., 2009). Descriptions of bacterial spot may use the species names, taxonomic groups A–D, or race designations. Several sources of resistance to bacterial spot have been identified. In most cases, the resistance is race specific as opposed to race non-specific (reviewed by Robbins et al., 2009). At any one time, a grower’s field can host multiple races of Xanthomonas. Therefore, developing resistant tomato varieties will require combining resistance to multiple Xanthomonas races, through a process referred to as trait pyramiding or gene pyramiding.
Techniques
Phenotyping is a term used to describe inheritance studies designed to measure differences in observed plant characteristics (resistance or susceptibility to bacterial spot, in this case). Two methods for inoculating tomato plants are typically used when evaluating—or phenotyping—germplasm for resistance to bacterial spot. Evaluation of field infections are based on the Horsfall–Barratt (1945) rating system. The scale is designed to compensate for human error in interpretation of the percentage of foliage infected. Small differences are easier to discriminate at the extremes of the scale, so the range of values for low infection and high infection percentages are narrow. In the middle of the scale, where it is more difficult to assess small differences, the range is larger. In contrast, greenhouse evaluations are based on a qualitative assessment (resistant or susceptible) of the hypersensitive response (HR).
Due to the nature of the data obtained in greenhouse vs. field trials (qualitative vs. quantitative data), data from these trials must be analyzed using different methods. For greenhouse data, non-parametric statistical methods are appropriate, while parametric methods are often appropriate for analyzing field data. However, the data analysis method also depends on the population structure (discussed below).
The germplasm tested might be that already found in the breeder’s collections, or germplasm studied and results published in peer-review research articles and/or germplasm databases.
Resources
Searches of the scientific literature can be helpful to see what research, if any, has been conducted for the trait of interest. The PubMed database (Fig. 1) is freely available to search; it contains citations, abstracts, and links to Full Text articles, as well as helpful tutorials and guides. PubMed is a good place to begin literature research, but it does not contain all agriculture-related journals, and further searches of commercial databases may be necessary.

Figure 1. PubMed database home page. Screenshot credit: Heather Merk, The Ohio State University.
Based on searches of the literature, breeders may wish to obtain exotic germplasm to evaluate for resistance. Because cultivated tomato has a narrow genetic base, wild species often provide the best source of new traits (in this case, resistance to bacterial spot). Tomato breeders have relied on wild species for new genetic material since the early 1900’s. The Tomato Genetics Resource Center (TGRC) (Fig. 2), the National Plant Germplasm System (NPGS), and the Germplasm Resources Information Network (GRIN) (Fig. 3) are resources to search for and obtain exotic tomato germplasm. GRIN is a comprehensive database containing information on plants, animals, microbes, and invertebrates. A tutorial for GRIN is available.
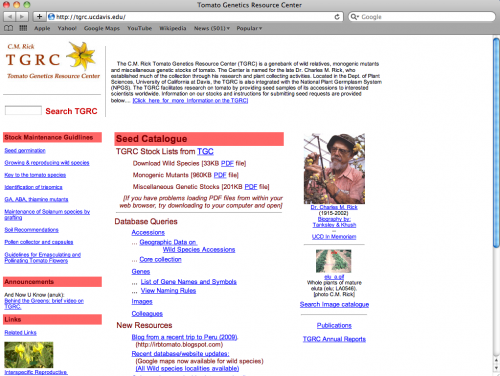
Figure 2. Tomato genetics resource center (TGRC) home page. Screenshot credit: Heather Merk, The Ohio State University.

Figure 3. National plant germplasm system home page. Screenshot credit: Heather Merk, The Ohio State University.
In the case of bacterial spot, a search of the literature reveals that Dr. John “Jay” Scott at the University of Florida, in cooperation with David Francis and Sally Miller at The Ohio State University, screened a collection of wild and cultivated tomato germplasm for resistance. They discovered resistance to race T3 in Hawaii 7981, PI 128216, and PI 126932 (Scott et al., 1995). Race T3 is one of five physiological races defined based on host resistance (see facts about Bacterial Spot). Although PI 128216 is listed in the NPGS as S. lycopersicum, it displays the finely divided leaves and currant-sized fruit of S. pimpinellifolium (Fig. 4).
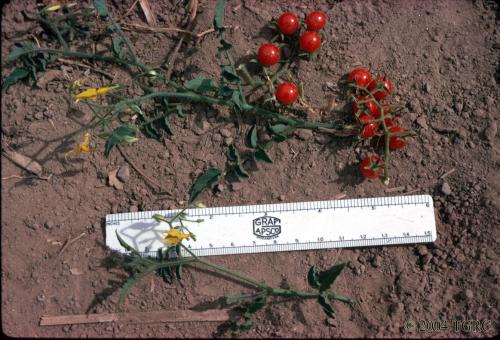
Figure 4. Branch from PI 128216, the bacterial spot-resistant parent. Photo credit: David Francis, The Ohio State University.
Developing Populations to Introgress Resistance and Identifying Markers Associated with Resistance
Background
After identifying PI 128216 as a source of resistance, the next step is to develop populations to incorporate (introgress) the new trait into the breeding program. Ideally, during this process we will determine the position of the resistance gene(s) or locus on the genetic map of the 12 tomato chromosomes. Genetic mapping will then provide the potential of identifying molecular markers linked to the resistance, thereby making it easier to ensure that plants with resistance are being kept throughout the generations of breeding and selection. To formulate a strategy for introgressing resistance and identifying markers associated with resistance, you will need to consider which populations and analyses will be appropriate.
To study resistance to bacterial spot conferred by PI 128216, an inbred backcross (IBC) population was first developed using a variation of the backcross breeding method. The IBC population allowed researchers and plant breeders to simultaneously introgress bacterial spot resistance and discover the potential location of genes from PI 128216 that mediate the hypersensitive response (HR).
The IBC population served as a hypothesis-generating population. To confirm the resistance regions identified in the IBC population and test the effects of genetic background on bacterial spot resistance, F2 populations were also developed. Both populations will be discussed in detail.
If you are not familiar with backcrossing, or you need to review some of the general principles, see the additional resources listed at the bottom of this page.
Techniques (Inbred Backcross (IBC) Population)
Population Development
An inbred backcross (IBC) population was developed with PI 128216 as the donor parent and OH88119 as the recurrent parent (Figs. 4 and 5). OH88119 was chosen because it was a suitable parent for commercial hybrids, but susceptible to bacterial spot (Fig. 4). Backcrossing was performed for two generations, followed by selfing for five generations to generate 189 BC2S5 (BC2 = second generation of backcross, S5 = fifth generation of self-pollination) lines. The two generations of backcrossing reduced the percentage of the unwanted donor genome. The five generations of selfing ensured that each family in the population approached the level of homozygosity of an inbred line. BC2S5 populations retain on average 87.5% of the recurrent parent and are homozygous across >99% of the genome.
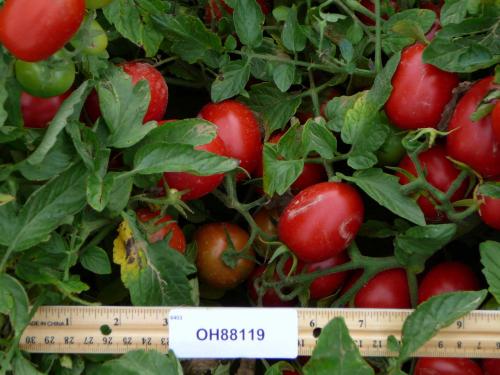
Figure 5. Close-up of OH88119, the bacterial spot susceptible parent. Photo credit: David Francis, The Ohio State University.
Phenotyping
Before conducting inheritance studies, experimental design must be considered to generate the most reliable trait data possible while minimizing field/greenhouse space, labor costs, and so forth. In this study, the considerations included the number of lines to be evaluated, the number of individuals of each line to evaluate, the appropriate controls, and the number of replications. When planning the experiment, the fact that the strength and clarity of the HR can be dependent on light and temperature was accounted for by repeating the experiment. The experiment replication was possible due to the fact that inbred backcross lines are >99% homozygous. Any difference in phenotype between the two greenhouses would be due to environmental factors, as phenotype is determined by the genotype and the environment.
A randomized complete block design was used to increase the experiment’s precision by minimizing error variance. Individual greenhouses were used as blocks, and IBC lines were randomized within the blocks. The bacterial-spot-susceptible and -resistant parental lines (OH88119 and PI 128216, respectively) were also evaluated and served as positive and negative controls. Plants were inoculated with the bacterial spot pathogen on two separate leaves, and resistance was evaluated on two separate days. Thus, there were eight evaluations per IBC line. A portion of the data file showing its structure is presented in Table 1. Plants showing an “HR” response were scored as R, and plants showing no symptoms or mild water soaking were rated as susceptible, S. If the reaction was ambigous, data were scored as missing using a period, .. The complete data file is available (IBCPhenotypeData1.xls).
| Greenhouse | Line | Leaf | Rating 24 hours post-inoculation | Rating 48 hours post-inoculation |
|---|---|---|---|---|
| 102 | 06.8001 | 1 | S | S |
| 102 | 06.8001 | 2 | S | S |
| 102 | 06.8002 | 1 | S | S |
| 102 | 06.8002 | 2 | S | S |
| 102 | 06.8003 | 1 | S | S |
| 102 | 06.8003 | 2 | S | R |
From Table 1, we can see that the data were not always consistent across rating days or repeated inoculations. For example, line 06-8003 was rated as susceptible for both inoculated leafs at 24 hours. However the second leaf was rated as showing an HR after 48 hours. It is therefore important to assess the data for consistency across both leaf and block (GH)—one reason that multiple leaves were inoculated in this study. These assessments are reflected in the data files, IBCPhenotypeData2.xls and IBCPhenotypeData3.xls, respectively. In these data files, the phenotypic evaluation for the two leaves and greenhouses were combined.
Genotyping
Genotyping is a process in which molecular biologists use molecular markers to characterize the genetic makeup of a plant. Leaf tissue samples were collected from each IBC line, as well as the parental lines, and genomic DNA was extracted. Next, each IBC line and each parental line was genotyped with 53 molecular markers that were polymorphic between the parental lines. To test for genetic factors (genes) affecting HR across all chromosomes, the markers chosen were scattered throughout the genome and spaced as evenly as possible accross the 12 chromosomes of tomato based on a previously developed genetic map. For more information on genetic mapping, which is used to determine relative molecular marker position, see the introduction to genetic mapping.
Analyses
Identifying Markers Associated with Resistance (Kruskal–Wallis)
To identify markers associated with resistance, the Kruskal–Wallis test was used to assess assocations between phenotype and genotype. That is, did each marker assort independently relative to HR? The Kruskal–Wallis test was appropriate in this case for two reasons. First, the unbalanced BC2S5 population structure has an expected 7:1 genotypic ratio. Therefore, only a relatively small number of the 189 BC2S5 lines would be expected to fit in the smaller class. Second, the qualitative disease resistance assesment (presence or absence of HR), lends itself to the nonparametric Kruskal–Wallis test.
Based on the values of the Kruskal–Wallis test statistic, H, markers LEOH200 and LEOH112 on chromosome 6 and COSOH57 and SL26101 on chromosome 11 did not assort independently relative to HR, suggesting possible linkage between these markers and HR.
Chi-square Goodness-of-Fit Analyses with Genotypic Data
After the genotypic data was collected, chi-square goodness-of-fit analyses were performed to determine whether each molecular marker was segregating in the expected ratio (Table 2). As a general rule, IBC populations display segregation ratios that are not balanced. For example, you expect a BC2S5 population to display 7:1 segregation ratio.
| Marker | Chromosome | 24 h | 48 h |
|---|---|---|---|
| LEOH200 | 6 | 0.0021 | 0.0039 |
| LEOH112 | 6 | 0.0378 | 0.0067 |
| SL10737i | 11 | 0.0434 | <0.0001 |
| SL10615i | 11 | <0.0001 | <0.0001 |
| CosOH57 | 11 | <0.0001 | <0.0001 |
| SL20181 | 11 | <0.0001 | <0.0001 |
Two markers on chromosome 6 and four markers on chromosome 11 did not meet the expected 7:1 segregation ratio (Table 2). In addition, the markers on chromosome 6 and CosOH57 and SL20181 on chromosome 11 did not assort independently of HR based on the Kruskal–Wallis statistic. These chi-square goodness-of-fit analyses indicate that conclusions about associations between the above markers and HR must be interpreted with caution. In addition, the first segregating population analyzed typically provides an hypothesis that is best tested in subsequent populations to confirm any identified associations with a marker and bacterial spot resistance. In this case, F2 populations were developed to confirm the associations.
Techniques (F2 Populations) – 1
Population Development
To confirm the associations between bacterial spot resistance and the molecular markers on chromosomes 6 and 11, as well as to improve germplasm, F2 populations were developed. In general, an F2 population is developed by crossing two inbred lines, resulting in F1 (or first filial) progeny. In the case of self-pollinated crops like tomato, the F1 progeny naturally self-pollinate, resulting in F2 progeny.
To confirm the associations between the markers on chromosomes 6 and 11 with HR that were identified in the IBC population, F2 families were developed by crossing three IBC lines to OH88119 and allowing the F1 progeny to self-pollinate. The IBC lines were chosen based on the presence of HR and the presence of the candidate HR alleles on chromosomes 6 and 11. With respect to genotype, the consideration of the desired individuals was two-fold. First, the desired individuals were homozygous at the marker loci associated with HR. This type of selection is referred to as forward selection. Second, the desired individuals had as little genome contribution as possible from the donor parent (PI 128216) other than in the regions associated with HR. This type of selection is referred to as background selection. Combining forward selection and background selection captures resistance from the donor parent (PI 128216) and maximizes contributions from the elite parent.
Analyses (F2 Populations) – 2
Graphical Genotyping
Graphical genotyping software was used to assist in identifying highly desirable lines. Graphical genotyping programs provide a visual, color-coded representation of the chromosomes based on the genotype of each marker. A tutorial was developed to teach users how to work with graphical genotyping software.
Marker-Trait Association
Based on the selection criteria outlined above, three IBC lines were selected to move forward within the breeding process. These populations were genotyped and phenotyped for bacterial spot resistance in the greenhouse as described for the IBC population, except that there was a single replication. Based on the Kruskal–Wallis statistic, HR was associated with markers on chromosome 11 but not markers on chromosome 6.
Techniques (F2 Populations) – 2
Population Development – 2
Next, experiments were conducted in four independent F2 populations to confirm that HR in the greenhouse corresponded to resistance to bacterial spot in the field as HR in the greenhouse does not always correspond to resistance in the field. Field evaluations were conducted using the Horsfall–Barrett scale. In addition, these experiments tested whether resistance to bacterial spot is dependent on genetic background.
The four F2 populations were developed using one of two resistant IBC lines with the candidate alleles for bacterial spot resistance as the female parent and an elite breeding line as the male parent (either OH88119, OH8245, or OH7530). The F1 hybrids were self-pollinated to create F2 populations for genotyping and disease evaluation in the field. Field evaluations were rated using the Horsfall–Barrett scale. In the field, individuals were organized into classes based on chromosome 11 marker genotype. These elite breeding lines were chosen in part due to their potential to develop improved germplasm, as discussed below.
Analyses (F2 Populations) – 2
Marker-Trait Association
The phenotype data collected in the field was combined with genotype data to find markers linked with HR. Single-marker analysis was performed to determine whether or not each molecular marker and disease resistance were associated (i.e. whether each marker and disease resistance were assorting independently). Significant deviations from independent assortment between a marker and trait indicate association (linkage) of particular marker with HR. Two markers on chromosome 11 (CosOH57 and SL26101) were confirmed as associated with bacterial spot resistance. These results define a single locus, Rx-4, as conferring early blight resistance. The PI 128216 allele (resistant parent) provided resistance. The degree of resistance also depended on the marker genotype. Individuals homozygous for the PI 128216 allele were more resistant than heterozygous individuals, which in turn were more resistant than individuals homozygous for the elite germplasm allele. However, the resistance was also dependent on genetic background provided by the elite breeding line (OH88119, OH8245, or OH7530).
Developing Improved Germplasm Using Molecular Markers
Background
To develop improved germplasm with resistance to bacterial spot conferred by PI 128216, F2 populations were developed using one of two resistant IBC lines with the candidate alleles for bacterial spot resistance as the female parent and an elite breeding line as the male parent (either OH88119, OH8245, or OH7530). The F1 hybrids were self-pollinated to create F2 populations for genotyping and disease evaluation in the field.
OH7530 was chosen as an elite breeding line as it has the additional bacterial disease resistance genes, Rx-3 and Pto. The presence of these additional bacterial resistance genes allowed for gene pyramiding to develop improved germplasm, as discussed below.
Techniques
In subsequent breeding populations, molecular markers associated with bacterial spot resistance can help predict which plants will be resistant. Selection based on molecular marker genotype can be particularly beneficial as it allows for selection at the seedling stage. However, molecular markers associated with disease resistance are not necessarily perfect predictors of resistance. For example, there may be genetic recombination between a marker and the resistance gene. In our case study, marker SL20181 genetically mapped 3.3 cM from Rx-4, our bacterial spot resistance gene. This means that 3.3 % of the time, when you select a tomato plant solely on the SL20181 genotype, you will NOT be selecting for the bacterial spot resistance. This stresses the importance of using molecular markers to complement phenotypic selection.
Analyses
Graphical genotyping software was used to assist in identifying highly desirable lines. Graphical genotyping programs provide a visual, color-coded representation of the chromosomes based on the genotype of each marker. A tutorial was developed to teach users how to work with graphical genotyping software.
Gene Pyramiding
Background
Molecular markers can also be very useful when combining multiple resistance genes (also known as gene pyramiding). This is because it can be difficult to distinguish, based on phenotype alone, those plants that carry all desired alleles from those that only have some of them.
Techniques
To combine Rx-4 with other genes that confer resistance to bacterial diseases, IBC lines were crossed with another elite parental line, OH7530. OH7530 has the additional bacterial disease resistance genes, Rx-3 and Pto. Both genes were genetically mapped to tomato chromosome 6. Rx-3 confers resistance to bacterial spot race T1 (Yang et al., 2005) and Pto confers resistance to bacterial speck race T0.
- Learn about combining two linked genes
- Learn how Rx-3 and Pto were combined into a single breeding line
Analyses
Graphical Genotyping
Graphical genotyping software was used to assist in identifying highly desirable lines. Graphical genotyping programs provide a visual, color-coded representation of the chromosomes based on the genotype of each marker. A tutorial was developed to teach users how to work with graphical genotyping software.
Conclusion
In this start-to-finish example, we used resistance to bacterial spot in tomato as an example of how molecular marker technology can be beneficial to plant improvement. These principles can be used for any tomato breeding program goal, as well as breeding with any crop. We learned that the first step in a breeding program is to clearly outline the goals. Next a breeder needs to do some research using genetic databases and published research to see if information about the trait they are interested has already been described and can be utilized in her/his particular program. We saw that wild species can be a valuable source of new traits and we learned how to access relevant resources. Once germplasm with the desired trait has been identified, populations useful for plant improvement can be used to simultaneously identify molecular markers linked to that trait and improve the overall genetic background of the breeding line. Furthermore, we learned that molecular markers can accelerate the plant improvement process and can be helpful when combining multiple loci conferring resistance to the same disease. Finally we talked about the importance of both genotyping and phenotyping techniques in overall crop improvement.
References
- Horsfall, J. G., and R. W. Barratt. 1945. An improved grading system for measuring plant diseases. Phytopathology 35: 655.
- Jones, J. B., G. H. Lacy, H. Bouzar, R. E. Stall, and N. W. Schaad. 2004. Reclassification of the xanthomonads associated with bacterial spot disease of tomato and pepper. Systematic and Applied Microbiology 27: 755–762. (Available online at: http://dx.doi.org/10.1078/0723202042369884) (verified 21 May 2012).
- Robbins, M. D., A. Darrigues, S. Sim, M.A.T. Masud, and D. M. Francis. 2009. Characterization of hypersensitive resistance to bacterial spot race T3 (Xanthomonas perforans) from tomato accession PI 128216. Phytopathology 99: 1037–1044. (Available online at: http://dx.doi.org/10.1094/PHYTO-99-9-1037) (verified 21 May 2012).
- Scott, J. W., J. B. Jones, G. C. Somodi, and R. E. Stall. 1995. Screening tomato accessions for resistance to Xanthomonas campestris pv. vesicatoria, race T3. HortScience 30: 579–581.
- Yang, W. C., E. J. Sacks, M.L.L. Ivey, S. A. Miller, and D. M. Francis. 2005. Resistance in Lycopersicum esculentum intraspecific crosses to race T1 strains of Xanthomonas campestris pv. vesicatoria causing bacterial spot of tomato. Phytopathology 95: 519–527. (Available online at: http://dx.doi.org/10.1094/PHYTO-95-0519) (verified 21 May 2012).
External Links
- Namuth-Covert, D., H. Merk, and C. Haines. Chi-Square Test for Goodness of Fit in a Plant Breeding Example [Online lesson]. Plant and Soil Sciences eLibrary, University of Nebraska-Lincoln. Available at: http://passel.unl.edu/pages/informationmodule.php?idinformationmodule=1130447119&topicorder=1&maxto=16&minto=1 (verified 21 May 2012).
- National Plant Germplasm System [Online]. United States Department of Agriculture, Agricultural Research Service. Available at: http://www.ars-grin.gov/npgs/ (verified 21 May 2012).
- PubMed [Online]. U. S. National Library of Medicine, National Institutes of Health. Available at: http://www.ncbi.nlm.nih.gov/pubmed (verified 21 May 2012).
- Shermin, J., and D. Quinn. Genetic mapping [Online lesson] Wheat CAP: Wheat Coordinated Agricultural Project. Available at: http://maswheat.ucdavis.edu/Education/animations/anim_mapping.htm (verified 21 May 2012).
- Tomato Genetics Resource Center [Online]. University of California, Davis. Available at: http://tgrc.ucdavis.edu/ (verified 21 May 2012).
- USDA, ARS, National Genetic Resources Program. PI 126932 – Solanum pimpinellifolium – 94 – Peru [Online}. Germplasm Resources Information Network – (GRIN). National Germplasm Resources Laboratory, Beltsville, Maryland. Available at: http://www.ars-grin.gov/cgi-bin/npgs/acc/display.pl?1133159 (verified 21 May 2012).
- USDA, ARS, National Genetic Resources Program. PI 128216 – Solanum lycopersicum – 239 – Bolivia [Online]. Germplasm Resources Information Network – (GRIN). National Germplasm Resources Laboratory, Beltsville, Maryland. Available at: http://www.ars-grin.gov/cgi-bin/npgs/acc/display.pl?1133344 (verified 21 Mat 2012).
Additional Resources
For lessons that teach the principles of backcrossing:
- Baenziger, P. S., and P. Hain. 2005. Advanced backcross breeding [Online lesson]. Plant and Soil Sciences eLibrary, University of Nebraska – Lincoln. Available at: http://plantandsoil.unl.edu/croptechnology2005/pages/index.jsp?what=topicsD&topicOrder=1&informationModuleId=959723462 (verified 21 May 2012).
- Hain, P., and D. Lee. 2005. Backcross breeding 1 – basic gene inheritance [Online lesson]. Plant and Soil Sciences eLibrary, University of Nebraska – Lincoln. Available at: http://plantandsoil.unl.edu/croptechnology2005/pages/index.jsp?what=topicsD&topicOrder=1&informationModuleId=957885794 (verified 21 May 2012).
- Hain, P., and D. Lee. 2005. Backcross breeding 2 – the backcrossing process [Online lesson]. Plant and Soil Sciences eLibrary, University of Nebraska – Lincoln. Available at: http://plantandsoil.unl.edu/croptechnology2005/pages/index.jsp?what=topicsD&topicOrder=1&informationModuleId=959009357 (verified 21 May 2012).
For an introduction to molecular markers, linkage mapping, QTL analysis and marker assisted selection written for professional plant breeders:
- Collard, B.C.Y., M.Z.Z. Jaufer, J. B. Brouwer, and E.C.K. Pang. 2005. An introduction to markers, quantitative trait locus (QTL) mapping and marker-assisted selection for crop improvement: The basic concepts. Euphytica 142: 169–196. (Available online at: http://dx.doi.org/10.1007/s10681-005-1681-5) (verified 21 May 2012).
- Genotyping with Molecular Markers: Scoring a CAP marker on an agarose gel
Funding statement
Development of this lesson was supported in part by the National Institute of Food and Agriculture (NIFA) Solanaceae Coordinated Agricultural Project, agreement 2009-85606-05673, administered by Michigan State University. Any opinions, findings, conclusions, or recommendations expressed in this publication are those of the author(s) and do not necessarily reflect the view of the United States Department of Agriculture.
PBGworks 646