2010 Tomato Disease Workshop Presentations

Authors:

John McQueen, Oregon State University

Heather L. Merk, The Ohio State University

The talks at the Tomato Disease Workshop 2010 were recorded live and edited into instructional video clips. They cover various topics such as the Genome Browser, Illumina arrays, accessing sequencing resources, setting up data pipelines, and more.

All talks were recorded in front of a live in-person and online audience at the Tomato Disease Workshop 2010 in Florida.

Next Generation Sequencing. Allen Van Denyze, University of California, Davis.

Accessing Sequence Resources. David Francis, The Ohio State University.

Tomato Genome Browser (GBrowse) for Plant Breeders. Heather Merk, The Ohio State University.

BioInformatics 101. David Francis, The Ohio State University.

Working with Tomato Infinium Genotyping Data. Allen Van Denyze, University of California, Davis.

Downstream Analysis with SNP Markers. Sung-Chur Sim, The Ohio State University.

Funding Statement

Development of this page was supported in part by the National Institute of Food and Agriculture (NIFA) Solanaceae Coordinated Agricultural Project, agreement 2009-85606-05673, administered by Michigan State University. Any opinions, findings, conclusions, or recommendations expressed in this publication are those of the author(s) and do not necessarily reflect the view of the United States Department of Agriculture.

Mention of specific companies is not intended for promotional purposes.

PBGworks 995

Downstream Analysis of SNP Markers Using MSA, GGT, and STRUCTURE Software

Authors:

Sung-Chur Sim, The Ohio State University; Heather L. Merk, The Ohio State University

This webinar tutorial and the accompanying pdf and zip files were presented at the 2010 Tomato Disease Workshop. These materials outline the utility of MSA, GGT, and STRUCTURE software for downstream analysis with single nucleotide polymorphism (SNP) markers. In addition, a case study demonstrates the use of STRUCTURE for association mapping of bacterial spot resistance in tomato.

The pdf at the bottom of the page (Downstream_SNP_Analysis) is a copy of Dr. Sim’s presentation. The accompanying zip files (Downstream_Supplemental_Files) at the bottom of the page include a sample data set, an Excel file with best K analysis, and SAS code for association analysis that incorporates the Q matrix.

In the first video, Dr. Sung-Chur Sim, The Ohio State University, outlines the utility of MSA, GGT, and STRUCTURE software for downstream analysis with single nucelotide polymorphism (SNP) markers. Dr. Sim also explains where and how to download the software and how to format input data.


If you experience problems viewing this video connect to our YouTube channel or see the YouTube troubleshooting guide.

In the second video, Dr. Sim demonstrates the use of STRUCTURE for association mapping of bacterial spot resistance in tomato. Dr. Sim introduces association analysis models and emphasizes the use of the Q matrix to correct for population structure in association mapping. In addition, Dr. Sim explains the detailed steps in STRUCTURE to infer the best “K” (number of populations), which is required to obtain the Q matrix.

If you experience problems viewing this video connect to our YouTube channel or see the YouTube troubleshooting guide.

Find all the presentations from the 2010 Tomato Disease Workshop

References Cited

  • Evanno, G., S. Regnaut, and J. Goudet. 2005. Detecting the number of clusters of individuals using the software STRUCTURE: A simulation study. Molecular Ecology 14: 2611–2620. (Available online at: http://dx.doi.org/10.1111/j.1365-294X.2005.02553.x) (verified 12 May 2012).

External Links

Additional Resources

Funding Statement

Development of this lesson was supported in part by the National Institute of Food and Agriculture (NIFA) Solanaceae Coordinated Agricultural Project, agreement 2009-85606-05673, administered by Michigan State University. Any opinions, findings, conclusions, or recommendations expressed in this publication are those of the author(s) and do not necessarily reflect the view of the United States Department of Agriculture.

PBGworks 1005

Application of ANOVA for Plant Breeding: Single Marker Analysis Example using ANOVA in a Balanced Population (Sample SAS Program)

Author:

David M. Francis, The Ohio State University

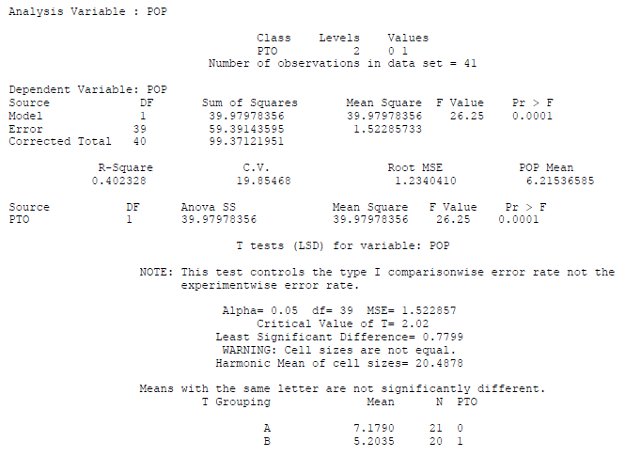
This page provides a sample SAS program used to analyze molecular marker data using ANOVA for single marker analysis. Two molecular markers are evaluated to determine whether genotype of each molecular marker results in differences in disease severity in a BC1 population.

This module provides an example of using analysis of variance (ANOVA) to assess differences in tomato bacterial spot resistance due to molecular marker genotype (treatment effect) to determine whether genotype of each molecular marker results in differences in disease severity in a BC1 population.

The following links provide:

SAS Code

The SAS code is presented in two ways:

  • As a screenshot taken from SAS after the code has been entered (Fig.1)
  • As plain text

Figure 1. SAS Screenshot taken after SAS code for analysis of variance in a balanced population was entered. Screenshot credit: David Francis, The Ohio State University.

Plain Text SAS Code

data map;
     infile ‘a:\lnkspt.csv’; delimiter = “,” firstobs = 4;
     input gen vsc pop tg23 pto;
proc sort;
     by tg23;
proc glm;
     class tg23;
     model pop = tg23;
     means tg23 / lsd lines;
proc sort;
     by pto;
proc glm;
     class pto;
     model pop = pto;
     means pto / lsd lines;
run;

Funding Statement

Development of this page was supported in part by the National Institute of Food and Agriculture (NIFA) Solanaceae Coordinated Agricultural Project, agreement 2009-85606-05673, administered by Michigan State University. Any opinions, findings, conclusions, or recommendations expressed in this publication are those of the author(s) and do not necessarily reflect the view of the United States Department of Agriculture.

PBGworks 906

Equation to Estimate Sample Size Required for QTL Detection

Authors:

David M. Francis, The Ohio State University; Heather L. Merk, The Ohio State University

This page provides an equation to estimate the required sample size to detect quantitative trait loci (QTLs) of varying effect in F2 and BC1 populations.

Introduction

Population size, structure, and the number of molecular markers genotyped can have significant impacts on quantitative trait locus (QTL) detection. This page focuses on the effect population size can have on QTL detection. Prior knowledge of theories regarding the genetics controlling the trait can help guide breeders as to the number of plants required to detect QTLs of various sizes using the following equation. Solving the equation below can help breeders optimize resources while still gaining the desired outcome.

Equation to Calculate Minimum Sample Size

Using units of phenotypic standard deviations, sample sizes can be estimated using the following equations:

For an F2 population,

NF2 = [1 – r2F2 / r2F2] x {[z(1 – (α / 2)) / (1 – r2F2)1/2] + z(1 – β)}2 x [1 + (k2 / 2)]

For a BC1 population,

NBC1 = [1- r2BC1 / r2BC1 ] x {[z (1 – (α / 2)) /(1 – r2BC1)1/2 ] + z(1 – β)}2 x [1 + (k2 / 2)]

In these equations,

  • r2 is the fraction of phenotypic variance explained by the QTL. Note that r2 is valid only for simple models. Mean Squares provide an alternative method to estimate fraction of phenotypic variation when models have replication and location.
  • k is the dominance coefficient (k = 0 for completely additive trait, k = 1 for completely dominant trait and k = -1 for completely recessive trait). This equation assumes that the marker and QTL are coincidental.
  • α is the type I error (the probability of incorrectly identifying an association that does not, in fact, exist)
  • β is the type II error (the probability of failing to identify a true association)
  • From normal distribution tables:
    • z(1-(α/2)) = 1.96 at α = 0.05
    • z(1–β) = 1.28 at ß = 0.10

For example, in an F2 population, the estimated sample size required to detect a dominant QTL that is responsible for 30% of the phenotypic variation is 46.

NF2 = [(1 – 0.30) / 0.30] x {[1.96 / (1 – 0.30)1/2] + 1.28}2 x [1 + (12 / 2)] = 46

Funding Statement

Development of this lesson was supported in part by the National Institute of Food and Agriculture (NIFA) Solanaceae Coordinated Agricultural Project, agreement 2009-85606-05673, administered by Michigan State University. Any opinions, findings, conclusions, or recommendations expressed in this publication are those of the author(s) and do not necessarily reflect the view of the United States Department of Agriculture.

PBGworks 862

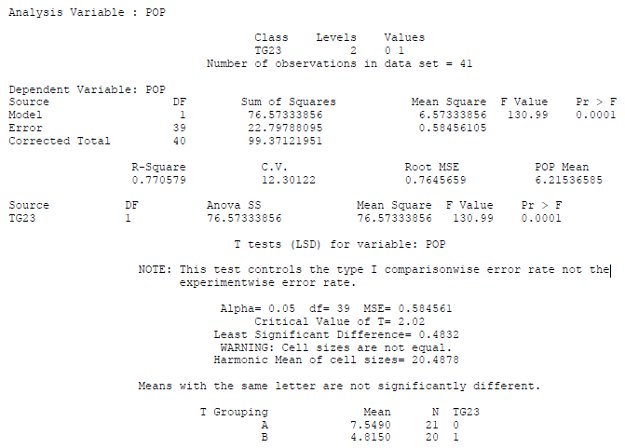
Application of ANOVA for Plant Breeding: Single Marker Analysis Example using ANOVA in a Balanced Population (SAS Output)

Author:

David M. Francis, The Ohio State University

This page provides the output for the single molecular marker analysis using ANOVA example. Two molecular markers are evaluated to determine whether the genotype of each molecular marker results in differences in disease severity in a BC1 population.

This module provides an example of using analysis of variance (ANOVA) to assess differences in tomato bacterial spot resistance due to molecular marker genotype (treatment effect) in a BC1 population.

The following links provide:

Funding Statement

Development of this page was supported in part by the National Institute of Food and Agriculture (NIFA) Solanaceae Coordinated Agricultural Project, agreement 2009-85606-05673, administered by Michigan State University. Any opinions, findings, conclusions, or recommendations expressed in this publication are those of the author(s) and do not necessarily reflect the view of the United States Department of Agriculture.

PBGworks 907

Traditional Molecular Markers

Authors:

David M. Francis, The Ohio State University

Heather L. Merk, The Ohio State University

Deana Namuth-Covert, University of Nebraska-Lincoln

This page provides a simple overview of traditional molecular markers based on DNA sequence variation and size polymorphism. Isozyme, RFLP, RAPD, AFLP, microsatellite/SSR, SCAR, and CAP markers are presented. These tools are still used in plant breeding programs, though newer molecular marker tools should also be considered when determining a particular program’s needs and resources.

Introduction

Molecular markers have great potential to assist breeders in developing improved varieties by complementing phenotypic selection. They work by either measuring directly or indirectly a specific DNA sequence difference between various genotypes. When these markers are found to be linked to a trait of interest, it can aid the breeder in more efficiently selecting the plants or lines to move forward in the program (forward selection). Markers can also be used to improve all other trait combinations in the germplasm, either by crossing out unwanted alleles or maintaining those of value (background selection). This module is structured to give an overview of the traditional view of molecular markers; as bands on a gel. Therefore, traditional markers indirectly measure DNA differences. With advances in DNA sequencing techniques, the cost of directly determining the sequence of a DNA fragment has dropped considerably. As a result, newer molecular marker tools are quickly becoming more common and are more effective in meeting plant breeding needs on a large scale. However, not all laboratories can currently afford to invest in the equipment required to take advantage of newer technologies and the newer technologies may not be more efficient on a small scale. You can also learn about this alternative view of molecular markers, where marker data is typically presented to breeders as fluorescence intensity values. This alternative view includes information about single nucleotide polymorphism (SNP) markers.

To understand the concepts behind any molecular marker system first requires an understanding of DNA and its structure, including the nucleotides and DNA base pairing.

Traditional View of Molecular Markers

This list of traditional molecular markers including their acronyms can give us some idea of the basis of the molecular marker. It also describes the differences (polymorphisms) in DNA sequences they target.

Isozyme: By measuring variations in enzymes, isozyme analysis exploits differences in the genes that code for or regulate enzyme synthesis or activity.

RFLP (Restriction Fragment Length Polymorphism): Indirectly measure DNA sequence differences based upon the varying lengths of DNA fragments resulting from cutting it with restriction enzymes. These “fragment length polymorphisms” are visualized by hybridizing the cut DNA with labeled probes from DNA libraries.

RAPD (Random Amplified Polymorphic DNA): Utilizing a large number of short DNA primers with varying sequences, this technique exploits differences in the primer binding sites as different DNA will be amplified by the polymerase chain reaction (PCR).

AFLP (Amplified Fragment Length Polymorphism): Utilizing restriction enzymes and a large number of short DNA primers with varying sequences, this technique exploits differences in the primer binding sites as different DNA will be amplified using PCR.

SSR (Simple Sequence Repeat) or microsatellite: Using PCR, this technique exploits differences in short repetitive sequences (e.g., CAA vs. CAACAACAA) by using specifically designed DNA primers that bind on each side of repetitive DNA sequences.

SCAR (Sequence Characterized Amplified Region): Exploit length differences between two PCR products (not necessarily repeats) by using specifically designed DNA primers that bind on each side of a difference in DNA sequence. These are often created by sequencing RAPD marker PCR products and then designing more specific DNA primers than are used for the original RAPD markers.

CAP (Cut/Cleaved Amplified Polymorphism): Exploit differences in DNA sequences between two PCR products based on the presence or absence of restriction enzyme cutting sites. These markers are often designed from RFLP markers.

Steps to Marker Detection

Each marker is detected differently, which allows us to look at the different types of variation listed above.

Isozyme: separate by starch gel and stain

RFLP: digest with restriction enzyme (RE), separate by agarose gel electrophoresis, transfer DNA to membrane, hybridize with labeled probe, visualize by autoradiography

RAPD: amplify by PCR, separate by agarose gel electrophoresis, visualize with Ethidium Bromide (EtBr) stain

AFLP: digest with RE, ligate to linker, amplify by PCR with labeled primer, separate by polyacrylamide gel electrophoresis, visualize by autoradiography

SSR: amplify by PCR, separate by agarose gel electrophoresis, visualize with EtBr stain

SCAR: amplify by PCR, separate by agarose gel electrophoresis, visualize with EtBr stain

CAP: amplify by PCR, digest with RE, separate by agarose gel electrophoresis, visualize with EtBr stain

Looking at the steps to marker detection can help us figure out how easy or difficult it may be to genotype using a particular molecular marker. For example, RFLP markers require a lot of steps and they also require steps that none of the other markers do, in particular creating a library of DNA or cDNA probes. This suggests that RFLPs take very specialized knowledge and laboratory skills to perform. People who have worked with RFLPs can tell you this is true! They likely prefer to work with markers that are PCR-based because once you have learned the PCR technique, you can work with many different types of molecular markers and PCR does not take long. Table 1 provides us with some more information to help us compare the different molecular markers. We know that PCR-based markers are advantageous, but the table provides us with some information we wouldn’t necessarily know based on the marker names or the detection steps alone. The additional resources listed at the end of this page can provide you with more in-depth information about these molecular markers.

Table 1. Marker systems, genetic properties, strengths, and limitations.
Molecular Marker Type of Inheritance PCR-Based? Strengths Limitations
Isozyme Co-dominant No – enzyme activity base
  • Fast relative to RFLP
  • Limited number of loci
  • Limited alleles per locus
  • Protein is measured (therefore not exact measure of genotype)
  • Tissue specificity/ environmental regulation
RFLP Co-dominant No
  • Fast
  • Large number of loci
  • Pre-screen for single copy sequences to be used as probes
  • Slower than isozymes
  • Assumption that when samples share a fragment, they share flanking cleavage sites
RAPD Dominant Yes
  • Fast
  • Measures phenotype in outcrossing species
  • Multiple loci can be scored in single reaction
  • Sensitive to reaction conditions (reproducibility issues)
  • Assumption that when two samples share a fragment, it is the same locus
AFLP Dominant Yes
  • Detects large number of bands and therefore polymorphism
  • Multi-step, therefore high technical requirements
SCAR Co-dominant Yes
  • Fast
  • Requires sequence data, therefore expensive to develop primers
CAP Co-dominant Yes  
  • Requires restriction enzyme digestion of PCR product, enzymes can be expensive
  • Requires sequence data, therefore expensive to develop primers
SSR Co-dominant Yes
  • Fast
  • Commercially available for some crops
  • Detect multiple alleles
  • Requires sequence data, therefore expensive to develop primers

Additional Resources

For a further introduction to molecular markers, see Chapter 3 (p. 45–83), Introduction to Genomics, in:

  • Liu, B. H. 1998. Statistical genomics: Linkage, mapping, and QTL analysis. CRC Press, Boca Raton, FL.

For an introduction to molecular markers, linkage mapping, QTL analysis, and marker-assisted selection written for professional plant breeders, see:

  • Collard, B.C.Y., M.Z.Z. Jaufer, J. B. Brouwer, and E.C.K. Pang. 2005. An introduction to markers, quantitative trait locus (QTL) mapping and marker-assisted selection for crop improvement: The basic concepts. Euphytica 142: 169–196. (Available online at: http://dx.doi.org/10.1007/s10681-005-1681-5) (verified 24 Mar 2012).

Funding Statement

Development of this page was supported in part by the National Institute of Food and Agriculture (NIFA) Solanaceae Coordinated Agricultural Project, agreement 2009-85606-05673, administered by Michigan State University. Any opinions, findings, conclusions, or recommendations expressed in this publication are those of the author(s) and do not necessarily reflect the view of the United States Department of Agriculture.

PBGworks 856

Pyramiding Resistance Genes for Bacterial Spot and Bacterial Speck on Tomato Chromosome 5

Authors:

Heather L. Merk, The Ohio State University; Deana Namuth-Covert, University of Nebraska-Lincoln

Pyramiding, or combining, genes on the same chromosome is a special case of gene pyramiding. This case study describes the use of molecular markers to pyramid two disease resistance genes on tomato chromosome 5: Rx-3 (resistance to tomato bacterial spot) and Pto (resistance to bacterial speck).

Introduction

Pyramiding genes on the same chromosome is a special case of gene pyramiding. This case study describes the use of molecular markers to pyramid two disease resistance genes on tomato chromosome 5: Rx-3 (resistance to tomato bacterial spot) and Pto (resistance to bacterial speck).

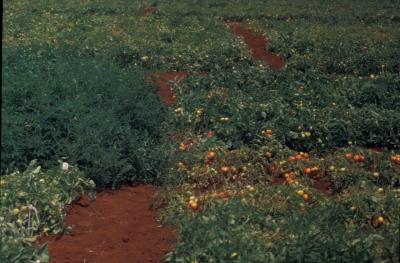
Bacterial spot and bacterial speck, two diseases with worldwide economic importance, can impact tomato crops simultaneously. Figure 1 shows a field affected by bacterial spot. Yang and Francis (2005) sought to combine resistance genes for both diseases. Although Yang and Francis (2005) knew from previous studies (Yang et al., 2005; Martin et al., 1993) that both resistance genes were on chromosome 5, they didn’t know the genetic distance between the two genes.

To combine Rx-3 and Pto, Yang and Francis (2005) crossed two inbred parents (see video): one homozygous for Rx-3 but susceptible to bacterial speck and the other homozygous for Pto but susceptible to bacterial spot. The video below outlines the general procedure for making crosses. The F1 progeny were self-pollinated to obtain F2 seed.


Figure 1. Tomato plot that includes tomato plants that are resistant (left) and susceptible (mid-right) to bacterial spot. Photo courtesy of David Francis, The Ohio State University.

In the F2 generation, Yang and Francis (2005) wanted to identify individuals resistant to bacterial spot and bacterial speck, and to calculate the genetic distance between Rx-3 and Pto. To achieve these objectives, Yang and Francis (2005) genotyped a population of 419 individuals with two molecular markers (one associated with Pto and one associated with Rx-3) to identify individuals with alleles that confer resistance to both diseases. In the case of Pto, the molecular marker was within the Pto gene, so Francis and Yang did not have to worry about recombination between the marker and gene. However, in the case of Rx-3, the molecular marker used to select for bacterial spot resistance was not within Rx-3, so recombination between the marker and Rx-3 was possible. This meant that selection based on the marker alone wouldn’t be perfect. In some cases, individuals with the resistant allele would be susceptible. Yang and Francis conducted phenotypic screenings to confirm that individuals expected to be resistant based on their genotype were, in fact, resistant.

Individuals with resistance to both bacterial spot and bacterial speck could only be obtained if a recombination event occurred between Pto and Rx-3, because each parent carried only one of the resistance genes. The chance of a recombination event depends on the genetic distance between Pto and Rx-3. Of the 419 F2 individuals genotyped, Yang and Francis identified 13 plants that were homozygous for bacterial spot and bacterial speck resistance alleles and 94 individuals that were heterozygous.

Yang and Francis estimated that Pto and the Rx-3 marker were 36.8 ± 2.2 cM apart. See the animation about genetic mapping to learn more about the principles of genetic mapping. The loose linkage between Pto and the Rx-3 marker means that breeders must take care to ensure that they maintain resistance conferred by Pto and Rx-3 when making crosses with individuals that have both these resistance genes.

References Cited

  • Martin, G. B., M. C. de Vicente, and S. D. Tanksley. 1993. High-resolution linkage analysis and physical characterization of the PTO bacterial-resistance locus in tomato. Molecular Plant-Microbe Interactions 6: 26–34. (Available online at: http://www.apsnet.org/publications/mpmi/BackIssues/Documents/1993Abstracts/Microbe06-026.htm) (verified 30 Aug 2012).
  • Yang, W., and D. M. Francis. 2005. Marker-assisted selection for combining resistance to bacterial spot and bacterial speck in tomato. Journal of the American Society for Horticultural Science 130: 716–721. (Available online at: http://journal.ashspublications.org/cgi/content/abstract/130/5/716) (verified 30 Aug 2012).
  • Yang, W. C., E. J. Sacks, M.L.L. Ivey, S. A. Miller, and D. M. Francis. 2005. Resistance in Lycopersicum esculentum intraspecific crosses to race T1 strains of Xanthomonas campestris pv. vesicatoria causing bacterial spot of tomato. Phytopathology 95: 519–527. (Available online at: dx.doi.org/10.1094/PHYTO-95-0519) (verified 30 Aug 2012).

External Links

Funding Statement

Development of this page was supported in part by the National Institute of Food and Agriculture (NIFA) Solanaceae Coordinated Agricultural Project, agreement 2009-85606-05673, administered by Michigan State University. Any opinions, findings, conclusions, or recommendations expressed in this publication are those of the author(s) and do not necessarily reflect the view of the United States Department of Agriculture.

PBGworks 903

Working with Infinium Genotype Data

Authors:

Allen Van Deynze, University of California, Davis; Kelly Zarka, Michigan State University

This page provides video and an audio-transcript of Dr. Allen van Deynze’s workshop “Working with Infinium Genotype Data”, originally presented at the SolCAP workshop at the Potato Association of America meeting in August 2010. This session focuses on highly parallel genotyping tools as we move away from scoring sequence polymorphism as a “band on a gel.”

This session will focus on highly parallel genotyping tools. We are moving away from scoring sequence polymorphism as a “band on a gel”. We will present the design of the SolCAP/Illumina consortium tool, discuss the resulting data format, and discuss quality control.

You can view the webinar below or at the SolCAP website.

View the webinar transcript.

If you experience problems viewing this video connect to our YouTube channel or see the YouTube troubleshooting guide.

 Presenter: Allen Van Deynze, University of California, Davis

View other SolCAP webinars

External Links

Funding Statement

Development of this page was supported in part by the National Institute of Food and Agriculture (NIFA) Solanaceae Coordinated Agricultural Project, agreement 2009-85606-05673, administered by Michigan State University. Any opinions, findings, conclusions, or recommendations expressed in this publication are those of the author(s) and do not necessarily reflect the view of the United States Department of Agriculture.

Mention of specific companies is not intended for promotional purposes.

PBGworks 884

Barley Production Resources

Authors:

Peggy Lemaux, University of California, Berkeley; Barbara Alonso, University of California, Berkeley; Karen Hertsgaard, North Dakota State University

Regional information on topics important to barley is necessary to optimize production and is provided through organizations, universities and research and extension centers.
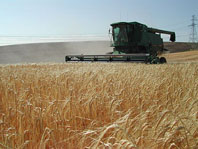

Photo credit: Patrick Hayes, BarleyWorld.org, Crop and Soil Science Department, Oregon State University

In the United States, barley is grown in 25 states, but the bulk of the production is in seven states. Each of these states hosts at least one checkoff organization, which collects money from producers to promote and support barley production, marketing, and research. As with most crops, certain information is critical for growers to optimize their chances to maximize production. Organizations, universities, and affiliated research and extension centers in each state provide such information on optimal variety selection, as well as state-specific information on marketing; economics; and prevalent diseases, insects, and weeds.

Idaho

Idaho Barley Commission is a self-governed state checkoff organization that works for Idaho barley producers to improve production and profitability of barley in the state. This site provides information on management practices, market reports, newsbriefs, nutrition, and publications.

Idaho Grain Producers Association represents Idaho grain producers at county, state, and federal levels to ensure the viability and profitability of their farming operations. This site provides information on markets, research, and state agricultural agencies, and it links to the Idaho Grain Magazine.

University of Idaho Extension. Provides information on crops, fertilizers and soils, direct seeding and conservation tillage, and pests and pesticides. This site also has information on insect pollinators and irrigation.

USDA/ARS Aberdeen National Small Grains Collection. Maintains collections representing global diversity of small grains, including barley. The site houses the Barley Genetic Stock Collection, which contains over 2,000 germplasm lines of diverse geographic origin.

Minnesota

The Minnesota Barley Research and Promotion Council is a state checkoff organization that works with Small Grains.org to support barley research and interests. The Small Grains site provides information on markets, policy, and production issues.

University of Minnesota Agricultural Experiment Station is responsible for up-to-date research information, showcasing yearly evaluations of yield, agronomic, and disease characteristics of multiple barley varieties in Minnesota.

Montana

Montana Wheat and Barley Committee is a Montana Department of Agriculture organization, funded and directed by producers through a checkoff program. Their goal is to protect the interests and viability of wheat and barley production in Montana. The site provides information on rail rates, weather, and news.

Montana Grain Growers Association is an association of grain producers that works to represent Montana grain growers through legislation efforts that affect farming. This site contains information on policy, research, news, and local events.

Montana State University Agricultural Research Centers are located throughout the state. This site provides localized information on research related to varieties, pest and disease control, and other barley production issues. 

North Dakota

North Dakota Barley Council is a producer-run organization, supported by checkoff funds, that provides information on barley utilization, research, marketing, and legislation. North Dakota is the top-ranked barley production state in the U.S.

North Dakota Grain Growers Association provides marketing and weather information, as well as the Gleaning newsletter, which contains information on grain yields, market prices, and other regional information of interest to growers.

NDSU Agricultural Experiment Station provides information on variety trial results, insect pest reports and management recommendations, and information on weeds and weed resistance.

North Dakota Irrigation Association has a publication that provides recommendations for irrigated malt barley production. Posted with permission by North Dakota Irrigation Association.

Institute of Barley and Malt Sciences. This institute provides information on the 2008, 2009, and 2010 American Malting Barley Association (AMBA) list of approved malting barley varieties. A detailed malting production calendar is also available.

Washington

Washington Grain Alliance provides funded research project summaries, as well as marketing and general crop information.

Washington State University Cereal Variety Testing Program provides weather data, variety brochures, and monthly rust updates.

Maryland

Maryland Grain Producers provides information on their checkoff grant program, general information on biofuels, and a speakers bureau established to raise awareness of agriculture.

University of Maryland’s Research and Extension Centers provide information on the use hulless barley for ethanol production and screening barley cultivars for ethanol production.

Oregon

Barley World, operated out of Oregon State University, offers an image gallery, information on barley food and straw and winter malting/food/forage barley breeding.

Oregon Wheat Growers League provides up-to-date local weather conditions.

Oregon State University, Crop and Soil Science Department barley page. This site contains information on varieties, diseases, nutrient management, and weeds.

Wisconsin

USDA-ARS-Cereal Crops Research Unit, located in Madison, WI. This site contains information about research programs and projects, barley quality analysis, and news.

United States

National Barley Growers Association is a national barley advocacy organization that works to ensure that US barley producers’ concerns are heard both nationally and internationally. This organization works closely with federal policymakers, congressional offices, and regulatory agencies to ensure barley producers’ concerns are addressed.

National Barley Improvement Committee is a national coalition representing barley producers, researchers, and end-users that works to address and discuss important national and regional barley research issues, and to ensure adequate funding for these areas. This site provides data on the economic significance of barley.

U.S. Grains Council is a private, nonprofit organization that works to build export markets for barley, corn, and sorghum. This site provides a database of grain suppliers and the Grains News newsletter.

U.S. Wheat and Barley Scab Initiative is an USDA–ARS-funded research project with the aim of developing effective control measures against Fusarium head blight (scab); the website provides links to a FHB risk assessment tool, Regional FHB Management Sites, and grain sampling for DON analysis.

International

Barley in China

. Article regarding the the Chinese barley industry and the cultural and national economic changes in recent years. Hertsgaard, K. and Wang, X. 2011. Barley in China. Institute of Barley and Malt Sciences Newsletter, Issue 14, April 2011. 

Funding Statement

Development of this page was supported in part by the National Institute of Food and Agriculture (NIFA) Barley Coordinated Agricultural Project, agreement 2009-85606-05701, administered by the University of Minnesota. Any opinions, findings, conclusions, or recommendations expressed in this publication are those of the author(s) and do not necessarily reflect the view of the United States Department of Agriculture.


PBGworks 938
Conventional Potato Breeding at Michigan State University

Authors:

Kelly Zarka, Michigan State University; David Douches, Michigan State University

The goal of the Michigan State University Potato Breeding and Genetics Program is to develop, through a combination of conventional and biotechnological approaches, potato cultivars with the requisite agronomic traits for a target market class; resistance to diseases, insects, and abiotic stresses; and enhanced nutritional qualities. Here we present a time line of conventional breeding activities.

Time-line of Conventional Breeding Activities

Year 1

Greenhouse crosses and population development. During the first year, between 600 and 800 crosses are made (Figs. 1 and 2). Once the true potato seed is harvested, potato family populations are developed by planting the seed and growing mini-tubers (Fig. 3).

Greenhouse facility at Michigan State University where potato crosses are made.

Figure 1. Greenhouse facility at Michigan State University where potato crosses are made. Photo credit: Michigan State University Potato Breeding and Genetics Program.

The progression of potato seed development from cross to seed.

Figure 2. The progression of potato seed development from cross to seed. Photo credit: Michigan State University Potato Breeding and Genetics Program.

Potato family mini-tuber production.

Figure 3. Potato family mini-tuber production. Photo credit: Michigan State University Potato Breeding and Genetics Program.

Year 2

The potato family mini-tubers which were harvested in the fall of the first year are planted in the field. Each year the MSU Potato Program plants 50,000 mini-tubers.  In the fall, after the growing season, single hill selections are made on phenotypic characteristics—appearance, yield, and maturity (Fig. 4). Usually, about 2,000 single hill selections are made every year.

Single hill selections are made in year 2.

Figure 4. Single hill selections are made in year 2. Photo credit: Michigan State University Potato Breeding and Genetics Program.

Year 3

The single hill selections made in year 2 are planted in the field as 12-hill plots (Fig. 5). At the end of the growing season, the 12 hills are evaluated phenotypically in the field and the selections (usually about 500) are harvested. These tubers then go through early-generation disease and insect resistance testing as well as DNA marker and chip quality analysis (Fig. 6).

The 12-hill potato plots are monitored throughout the growing season.

Figure 5. The 12-hill potato plots are monitored throughout the growing season. Photo credit: Michigan State University Potato Breeding and Genetics Program.

Selections made from 12-hill plots are sampled for disease testing and chipping analysis.

Figure 6. Selections made from 12-hill plots are sampled for disease testing and chipping analysis. Photo credit: Michigan State University Potato Breeding and Genetics Program.

Year 4–5

In year 4, the selections made in year 3 are planted in a 30-hill trial and go through another year of phenotypic evaluations, selections, disease testing, and chipping quality testing. Usually 200 selections make it through year 4. The process continues in year 5 with 50-hill plots concurrent with replicated agronomic trials. By the end of year 5, around 25 selections are recognized as advanced breeding lines. These lines are transferred to our tissue culture laboratory where virus and disease free plantlets are grown on nutritional media in test tubes (Fig. 7).

Selected potato varieties are grown in our Tissue Culture facility at MSU. Potato plantlets grow in a sterile test tubes with nutritional media.

Figure 7. Selected potato varieties are grown in our Tissue Culture facility at MSU. Potato plantlets grow in a sterile test tubes with nutritional media. These plantlets can then be used to grow certified seed tubers in the greenhouse or field. Photo credit: Michigan State University Potato Breeding and Genetics Program.

Year 6–7

During these years advanced agronomic trials are conducted, including on-farm grower testing and regional testing. Quality evaluations (Fig. 8) and disease and insect resistance testing continues. Chip quality testing continues and storage testing is conducted.

Potato selections go through extensive agronomic testing. Here scientist are evaluating quality, size, and density of the MSU potato variety called Michigan Purple.

Figure 8. Potato selections go through extensive agronomic testing. Here scientists are evaluating quality, size, and density of the MSU potato variety called Michigan Purple. Photo credit: Michigan State University Potato Breeding and Genetics Program.

Year 8–12

Throughout years 8–12, large scale agronomic and storage testing (Fig. 9) is conducted. Variety Release and Plant Variety Protection is considered. Certified potato seed tuber production is initiated. Contracts with seed growers are prepared.

The C. E. Burt Cargill Demonstration Storage Facilty is located at the MSU Montcalm Research Facility.

Figure 9. The C. E. Burt Cargill Demonstration Storage Facilty is located at the MSU Montcalm Research Facility. It is a state-of-the-art facility to test potato storage conditions. Photo credit: Michigan State University Potato Breeding and Genetics Program.

Additional Resources

For more information on the Michigan State University Potato Breeding and Genetics Program, visit our website at http://potatobg.css.msu.edu/.

Funding Statement

Development of this page was supported in part by the National Institute of Food and Agriculture (NIFA) Solanaceae Coordinated Agricultural Project, agreement 2009-85606-05673, administered by Michigan State University. Any opinions, findings, conclusions, or recommendations expressed in this publication are those of the author(s) and do not necessarily reflect the view of the United States Department of Agriculture.

PBGworks 888