
Authors:
David M. Francis, The Ohio State University
Heather L. Merk, The Ohio State University
Graphical Genotyping
Graphical genotyping, proposed by Young and Tanksley (1989), allows breeders to visualize the genotype of individuals and populations, which can help breeders identify desirable individuals based on their genotype. For example, a breeder may want to identify individuals with desirable alleles for a number of traits and with minimal unwanted alleles elsewhere in the genome. When allele states are coded and arranged in a map order (either genetic or physical), the graphical genotype displays the parental origin and allele composition across the entire genome. In addition, graphical genotypes can be viewed for specific chromosomes (Fig. 1).
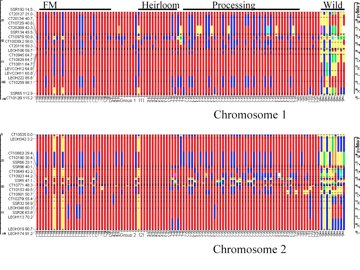
Figure 1. Graphical genotypes for chromosomes 1 and 2 of tomato. The linkage map is illustrated to the left of each graph. Markers are color-coded based on allele number and state. Data are for a germplasm collection consisting of fresh-market (FM) and processing tomato breeding material, older (Heirloom) varieties, and wild species used as donor parents. Graphical genotype provided by David Francis, The Ohio State University.
Graphical Genotyping Software
A tool to create graphical genotypes was described by Van Berloo (2008). GGT (Graphical GenoTypes) is a software package that assists in graphical representation of molecular marker data, which can assist in the process of selection and evaluation of plant material. The software and manual are available from Wageningen University. At Ohio State University a tutorial has been developed to instruct users how to download and install GGT software and how to load and manipulate data.
The graphical genotyping software Flapjack (Milne et al, 2010), was recently developed to handle large volumes of data. Flapjack is freely available for download and unlike GGT2, it is compatible with Mac OS X.
References Cited
- Milne, I., P. Shaw, G. Stephen, M. Bayer, L. Cardle, W.T.B. Thomas, A. J. Flavell, and D. Marshall. 2010. Flapjack—graphical genotype visualization. Bioinformatics 26: 3133–3134. (Available online at: http://dx.doi.org/10.1093/bioinformatics/btq580) (verified 27 Jan 2011).
- Van Berloo, R. 2008. GGT 2.0: Versatile software for visualization and analysis of genetic data. Journal of Heredity 99(2): 232–236. (Available online at: http://dx.doi.org/10.1093/jhered/esm109) (verified 29 Dec 2010).
- Young, N. D., and S. D. Tanksley. 1989. Restriction fragment length polymorphisms maps and the concept of graphical genotypes. Theoretical and Applied Genetics 77(1): 95–101. (Available online at: http://dx.doi.org/10.1007/BF00292322) (verified 29 Dec 2010).
External Links
- Flapjack – graphical genotyping [Online]. SCRI Plant Bioinformatics Group. Available at: http://bioinf.scri.ac.uk/flapjack/ (verified 27 Jan 2011).
- Graphical Genotypes [Online]. Wageningen University. Available at: http://www.plantbreeding.wur.nl/UK/software_ggt.html (verified 5 Oct 2010).
Funding Statement
Development of this page was supported in part by the National Institute of Food and Agriculture (NIFA) Solanaceae Coordinated Agricultural Project, agreement 2009-85606-05673, administered by Michigan State University. Any opinions, findings, conclusions, or recommendations expressed in this publication are those of the author(s) and do not necessarily reflect the view of the United States Department of Agriculture.
PBGworks 870