
Author:
Shawn C. Yarnes, The Ohio State University
Defining Variables and Experimental Units
Experimental design begins with the formulation of experimental questions, which help define the variables that will change in an experiment. Experimental treatments, or independent variables, are the controlled part of an experiment expected to affect the response, or dependent variables. The experimenter must identify which treatment and response variables will best answer experimental questions.
Consider the broad experimental question. How do plants respond to fertilizer application? This question must be made more specific to design an effective experiment.
The dependent variable, plant response, can be defined and measured in numerous ways. If the experimenter is interested in plant growth and nitrogen content, the question can be made more specific by asking how does plant growth and nitrogen content change in response to fertilizer application? Determination of response variables is influenced by experimental objectives and practical considerations. For example, total dry weight is more accurate than height as a measurement of plant growth, but in the case of a tree experiment, height might be more practical.
The independent variable, fertilizer treatment, can also be defined in numerous ways that will help specify experimental questions. A single fertilizer treatment with different levels can be tested, or multiple fertilizers compared. Levels can be: qualitative, or categorical, as when denoting males and females in a population; or quantitative, such as different fertilizer concentrations. Levels can also be defined as fixed or random effects. Sex distribution in a population is generally a random effect; while fertilizer application is an experimenter controlled, or fixed effect. The decision to define a variable as fixed or random will affect future statistical analyses (See Analysis of Variance (ANOVA): Experimental Design for Fixed and Random Effects).
Once response and experimental treatments are defined, proper control treatments must be determined. Controls are integral to the scientific method by providing baseline values against which other treatments are compared. Negative controls, such as non-fertilized plants in Example 1, are null treatments where no response is expected. The simplest experiment has one response variable, one negative control, and one treatment. If experimental results support a null hypothesis (H0), no significant difference is observed between controls and other treatments.
Positive controls are treatments where a known response is expected. Positive controls are often used to validate assays or equipment functioning. For example, many enzyme kits come with pre-digested substrates, so that experimental digestions can be deemed successful compared to the positive control. Positive controls can also be used to calibrate or standardize measurements. For example, a standard curve of known substrate concentrations can be used to calculate the amount of unknown substrate concentrations.
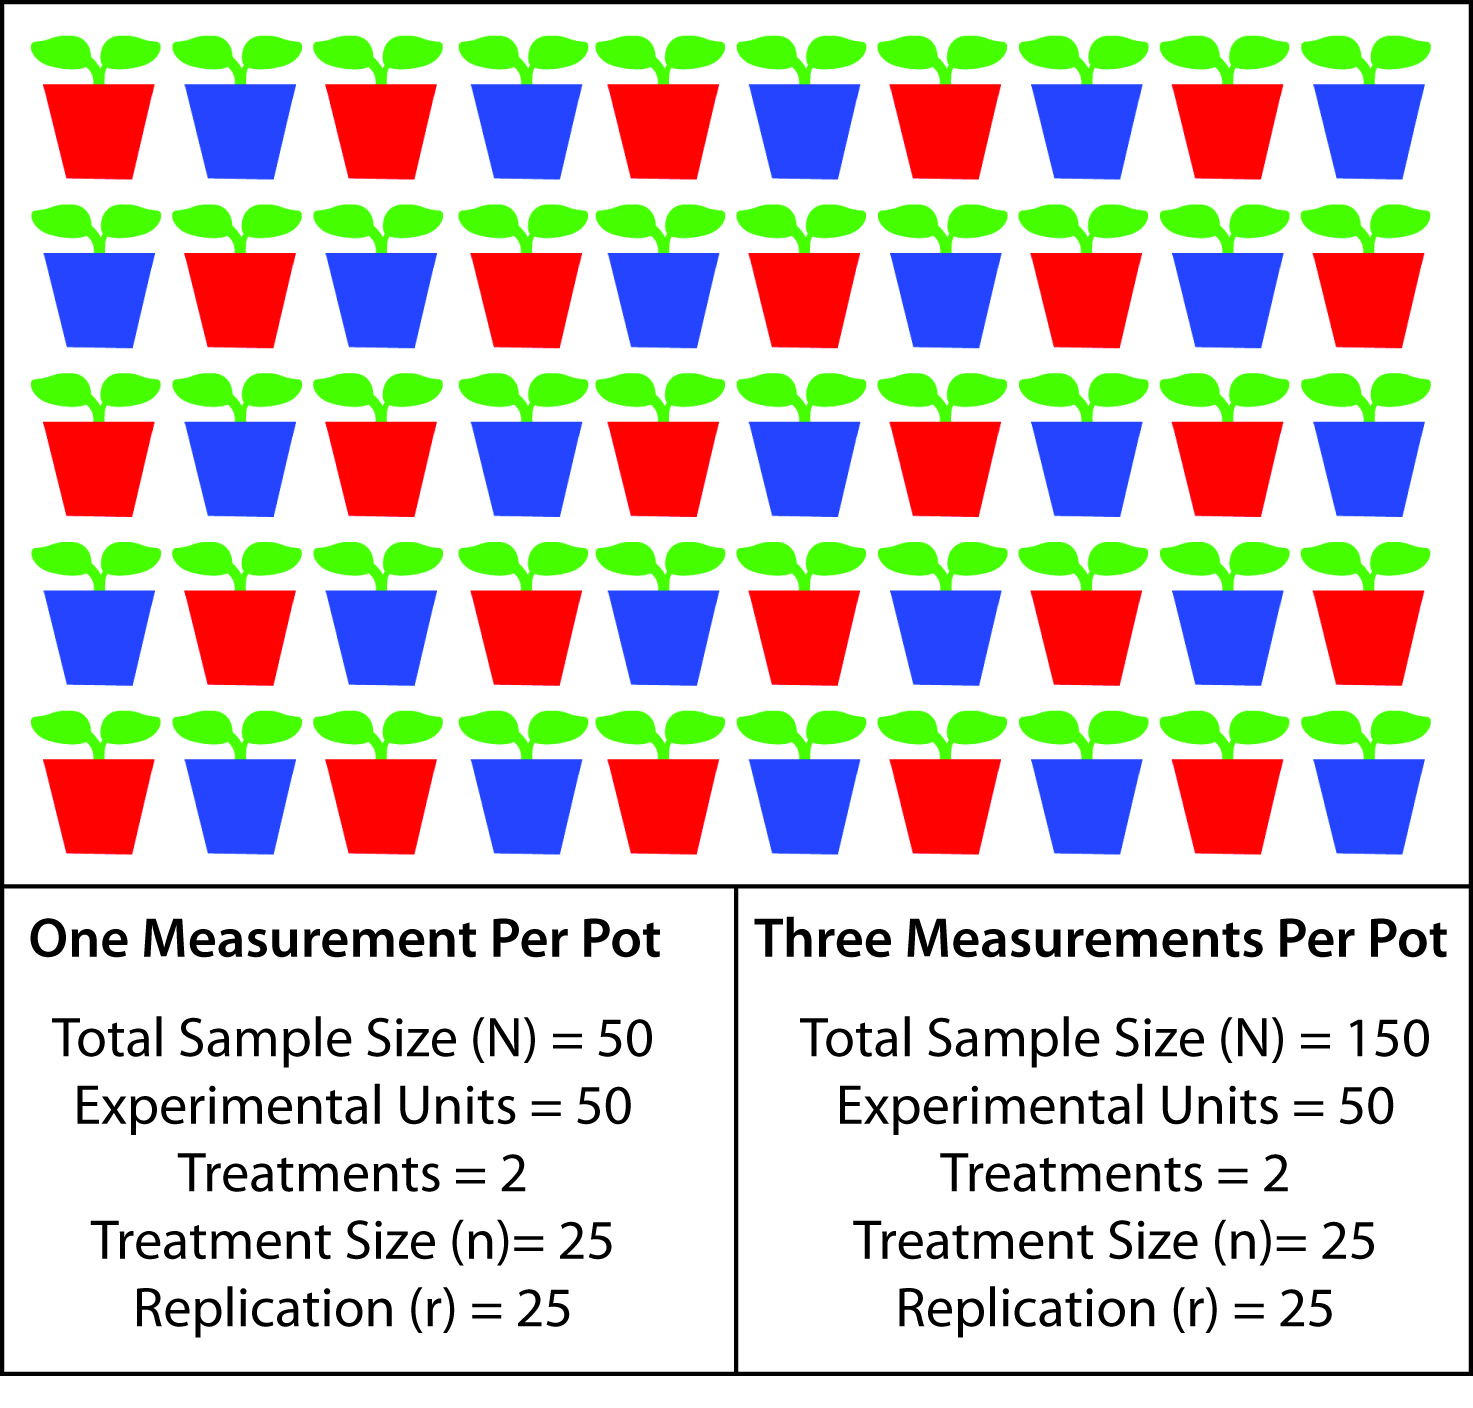
Experimental units must be defined during experimental design. The experimental unit is an individual, object, or plot subjected to treatment independently of other units. The number of experimental units is the sum of all treatments, levels, and and replicates. When experimental units are sampled only once, the experimental unit and sampling unit are the same. The experimental unit can also be comprised of multiple sampling units. When experimental units are heterogeneous for the response variable, the mean of multiple sample units can be more precise than a single measure. For example, if leaf nitrogen content is variable between leaves, an experimenter may choose to measure the nitrogen content from multiple leaves, using the mean nitrogen content to represent the individual plant. Increasing the sampling units does not increase replication.
Planning for Statistical Inference
The goal of an experiment is to detect differences between treatments. Statistical determination of these differences requires replication to compute experimental error and randomization to help ensure that the measure of experimental error is valid. Discussions of experimental error and replication become circular, because replications are needed to compute experimental error, and the number of replications needed is based on the magnitude of experimental error. Experimental design requires an a priori estimation of error. In some situations a preliminary study is used to estimate error. In other situations error is inferred using reasonable assumptions based on the current understanding of the study system.
Experimental Error
Experimental error is the variation among experimental units within the same treatment group. There are many possible reasons for error. Errors within an experiment are additive. Reducing the amount of error in an experiment increases your ability to detect significant differences between treatments. A well-designed experiment considers the error contributed by both natural variation and lack of experimental uniformity.
Natural variation is a large component of error in biological experiments. Genetic and developmental differences, as well as differences in species abundance and diversity, can vary between experimental units. In plant breeding, clones and inbreed lines are often utilized to reduce genetic variation between experimental units.
Lack of experimental uniformity is the source of error over which an investigator has the most control. Although there is always an imperfect ability to provide identical environments for each experimental unit, identifying and controlling error is essential. Errors in technique and/or data recording can inflate estimated experimental error (decrease precision) and introduce bias into the results (decrease accuracy).
Relationship Between Error and Sample Size
The sample size needed to detect differences between treatments increases with error. This is the reason biological field experiments generally require larger sample sizes than more controlled laboratory experiments. Experimental effort and expense are directly proportional to sample size. For these reasons controlling error is the focus of every investigator.
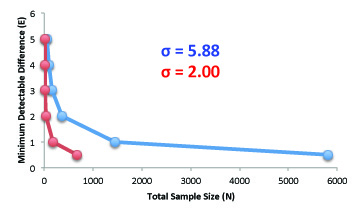
The graph below illustrates the realtionship between error (σ), sample size, and the ability to detect differences between two means. (See Estimating Sample Size for Comparison of Two Means and Equation to Estimate Sample Size Required for QTL Detection).
Funding Statement
Development of this page was supported in part by the National Institute of Food and Agriculture (NIFA) Solanaceae Coordinated Agricultural Project, agreement 2009-85606-05673, administered by Michigan State University. Any opinions, findings, conclusions, or recommendations expressed in this publication are those of the author(s) and do not necessarily reflect the view of the United States Department of Agriculture.
PBGworks 1445