
Author:
Carlos Hernandez-Garcia, The Ohio State University
Introduction
Expression databases hosting microarray-derived data have been fundamental to study gene expression in plants; however, this technology is biased toward known ribonucleic acids (RNAs) used to generate the probes for microarray chips. With the advent of next-generation sequencing (RNA-Seq), global RNA (transcriptome) analysis is becoming routine for many plant species. RNA-Seq is a powerful tool not only to validate gene annotation, but also to unravel quantitative gene expression for all sets of genes transcribed in a sample. The vast amount of information generated using RNA-Seq technology allows the generation of databases that capture a wider snapshot of the transcriptome, including absolute numbers of transcripts for most genes in the genome.
See below for the attached pdf tutorial.
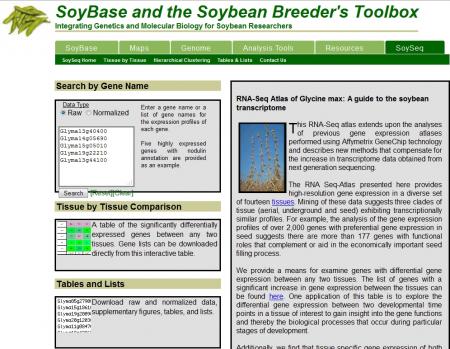
Figure 1. Screenshot of the soybase homepage. Soybase is one of the expression databases featured in the tutorial. Screenshot credit: Heather Merk, The Ohio State University.
References Cited
- Kalinski, A., J. M. Weisman, B. F. Mathews, and M. Herman. 1989. Molecular cloning of a protein associated with soybean seed oil bodies that is similar to thiol proteases of the papain family. Journal of Biological Chemistry 265: 13843-13848.
- Libault, M, A. Farmer, T. Joshi, K. Takahashi, R. J. Langley, L. D. Franklin, J. He, D. Xu, G. May, and G. Stacey. 2010. An integrated transcriptome atlas of the crop model (Glycine max) and its use in comparative analyses in plants. Plant Journal 63: 86-99. (Available online at: http://dx.doi.org/10.1111/j.1365-313X.2010.04222.x) (verified 3 May 2012).
- Natarajan, S. S., C. Xu, H. Bae, T. J. Caperna, and W. Garrett. 2007. Determination of optimal protein quantity required to identify abundant and less abundant soybean seed proteins by 2D-PAGE and MS. Plant Molecular Biology Report 25: 55-62.
- Severin, A., J. Woody, Y. –T. Bolon, B. Joseph, B. Diers, A. Farmer, G. Muehlbauer, R. Nelson, D. Grant, J. Specht, M. Graham, S. Cannon, G. May, C. Vance, and R. Shoemaker. 2010. RNA-Seq Atlas of Glycine max: A guide to the soybean transcriptome. BMC Plant Biology 10: 160. (Available online at: http://dx.doi.org/doi:10.1186/1471-2229-10-160) (verified 3 May 2012).
- Vodkin, L.O., and N. V. Raikhel. 1986. Soybean lectin and related proteins in seeds and roots of Le+ and Le− soybean varieties. Plant Physiology 81: 558–565.
External Links
- Arabidopsis Transcriptome Genomic Express Database [Online]. Salk Institute Genomic Analysis Laboratory. Available at: http://signal.salk.edu/cgi-bin/atta (verified 3 May 2012).
- The Bio-Array Resource for Plant Biology [Online]. University of Toronto. Available at: http://www.bar.utoronto.ca (verified 3 May 2012).
- Maize C3/C4 Transcriptomic Database [Online]. Cornell University. Available at: http://c3c4.tc.cornell.edu/search.aspx (verified 3 May 2012).
- Medicago truncatula Gene Expression Atlas [Online]. The Samuel Roberts Noble Foundation. Available at: http://mtgea.noble.org/v2/ (verified 3 May 2012).
- Next Generation Sequencing for Plant Breeders [Online]. The Plant Breeding and Genomics Community, eXtension. Available at: http://www.extension.org/article/32489 (verified 3 May 2012).
- PopGenIE: The Populus Genome Integrative Explorer [Online]. Popgenie.org. Available at: http://www.popgenie.org/ (3 May 2012).
- RiceGE Japonica: Rice Functional Genomic Express Database [Online]. Salk Institute Genomic Analysis Laboratory. Available at: http://signal.salk.edu/cgi-bin/RiceGE (verified 3 May 2012).
- RiceGE: Rice (indica) Functional Genomic Express Database [Online]. Salk Institute Genomic Analysis Laboratory. Available at: http://signal.salk.edu/cgi-bin/RiceiGE (verified 3 May 2012).
- RNA-Seq Atlas of Glycine max [Online]. Soybase and the Soybean Breeder’s Toolbox. Available at: http://soybase.org/soyseq/ (verified 3 May 2012).
- Soybean Upstream Regulatory Element (SURE) Database [Online]. The Ohio State University, OARDC. Available at: http://www.oardc.ohio-state.edu/SURE/ (verified 3 May 2012).
- Soybean eFP Browser [Online]. The Bio-Array Resource for Plant Biology, University of Toronto. Available at: http://www.bar.utoronto.ca/efpsoybean/cgi-bin/efpWeb.cgi (verified 3 May 2012).
- Tomato Expression Database (TED) [Online]. Boyce Thompson Institute for Plant Research, Cornell University. Available at: http://ted.bti.cornell.edu/ (verified 3 May 2012).
- Transcriptome Atlas of Glycine max [Online]. Digital Biology Laboratory, University of Missouri. Available at: http://digbio.missouri.edu/soybean_atlas/ (verified 3 May 2012).
Funding Statement
Development of this lesson was supported in part by the National Institute of Food and Agriculture (NIFA) Solanaceae Coordinated Agricultural Project, agreement 2009-85606-05673, administered by Michigan State University and CONACYT, Mexico. Any opinions, findings, conclusions, or recommendations expressed in this publication are those of the author(s) and do not necessarily reflect the view of the United States Department of Agriculture or any of the other aforementioned entities.
Attachments:
TranscriptomicTutorialCarlosfinal.pdf (3.11 MB)
PBGworks 1095