
Authors:
Heather L. Merk, The Ohio State University; Nicholas Wheeler, Oregon State University; Sung-Chur Sim, The Ohio State University; M. Awais Khan, University of Illinois, Urbana-Champaign; David Harry, Oregon State University; Jennifer Kling, Oregon State University; Zhifen Zhang, The Ohio State University; Allen Van Deynze, University of California, Davis; David Francis, The Ohio State University
Data Pipeline
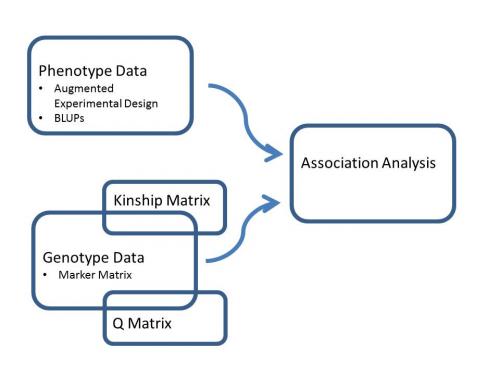
Figure 1. Data pipeline for association analysis.
Learning Modules
Tutorials
The Unified Mixed Model
y = μ + Sα + Qv + Zu + e
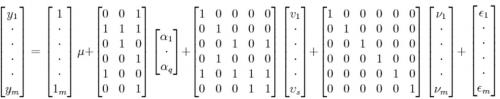
Phenotype Data (y)
- m x 1 vector of phenotypic values, where m is the total number of observations
- Designing experiments using augmented experimental design
- Obtaining best linear unbiased predictors (BLUPs)
Genotype Data
Marker Matrix (Sα)
- m by q matrix, where m is the total number of observations and q is the number of genotypes at a marker locus
- Analyzing SNP quality
Population Structure (Q matrix – Qv)
- m by s matrix, where m is the total number of observations and s is the number of sub-populations
- Assigning individuals to sub-populations using Structure (video)
- Assigning individuals to sub-populations using Structure (text)
Kinship Matrix (Polygene effect – Zu)
- m by n matrix, where m is the total number of observations and n is the number of individuals
- Creating a kinship matrix using MSA
Marker Coverage
Combined Analysis
Additional Resources
The Unified Mixed Model
- Unified Mixed Model [Online]. Buckler Lab for Maize Genetics and Diversity. Available at: http://www.maizegenetics.net/unified-mixed-model (verified 29 March 2012).
- Yu, J., G. Pressoir, W. H. Briggs, I. V. Bi, M. Yamasaki, J. F. Doebley, M. D. McMullen, et al. 2006. A unified mixed-model method for association mapping that accounts for multiple levels of relatedness. Nature Genetics 38: 203-208. (Available online at: http://dx.doi.org/10.1038/ng1702) (verified 29 March 2012).
Accounting for Population Structure
- Price, A. L., N. J. Patterson, R. M. Plenge, M. E. Weinblatt, N. A. Shadick, and D. Reich. 2006. Principal components analysis corrects for stratification in genome-wide association studies. Nature Genetics 38: 904-909. (Available online at: http://dx.doi.org/10.1038/ng1847) (verified 29 March 2012).
- Pritchard, J. K., M. Stephens, and P. Donnelly. 2000. Inference of population structure using multilocus genotype data. Genetics 155: 945–959. (Available online at: http://www.genetics.org/cgi/content/abstract/155/2/945) (verified 29 March 2012).
SAS Code for Association Analysis
- Statistical Genetics [Online]. Buckler Lab for Maize Genetics and Diversity. Available at: http://www.maizegenetics.net/statistical-genetics (verified 29 March 2012).
Creating Matrix Equations Online
- Vanovschi, V. Latex Equation Editor [Online]. The Number Empire. Vanovschi, V. Available at: http://www.numberempire.com/texequationeditor/equationeditor.php (verified 28 March 2012).
Funding Statement
Development of this page was supported in part by the National Institute of Food and Agriculture (NIFA) Solanaceae Coordinated Agricultural Project, agreement 2009-85606-05673, administered by Michigan State University. Any opinions, findings, conclusions, or recommendations expressed in this publication are those of the author(s) and do not necessarily reflect the view of the United States Department of Agriculture.
PBGworks 1333