
Author:
M. Awais Khan, University of Illinois, Urbana-Champaign
Introduction
Association mapping, also known as linkage disequilibrium (LD) mapping, is a method used to identify marker alleles associated with phenotypic traits. It makes use of ancestral recombinations present in the gene pool of a species to identify marker/trait associations. In recent years, there is increasing interest from plant geneticists to use association mapping as an alternative approach to overcome shortcomings of pedigree-based quantitative trait locus (QTL) mapping. In some plants, for example, forest trees and perennial horticultural fruits, pedigree-based mapping is unsuitable due to their long juvenile period and labor intensive and time-consuming trait evaluation. Moreover, usually QTL intervals are quite large, and contain many genes. Therefore, transferring multiple minor effect QTLs via marker-assisted breeding can lead to genetic drag (due to the presence of undesirable traits in the QTL interval). Thus, prior to using QTLs via positional cloning or marker-assisted selection in crop improvement, individual genes must be identified via fine-mapping, a time-consuming, laborious, and costly effort. Contrary to QTL mapping, association mapping needs large numbers of molecular markers and uses recombination events present within the gene pool of an organism. Therefore, in association mapping, only those markers that are tightly linked to the locus of interest and that are within the extent of the LD decay of the genome will show significant associations. Thus the marker-trait associations identified through association mapping are very close or within the gene affecting the trait and results are applicable to wider germplasm.
Recently, to further increase the power and mapping resolution of marker-trait associations by utilizing joint strength of pedigree-based mapping and association analysis, a Nested Association Mapping (NAM) population in maize and the Multiparent Advanced Generation Inter-Cross (MAGIC) lines in Arabidopsis were constructed. NAM was developed by crossing 25 diverse maize inbred lines (to maximize the diversity) to B73 (a reference inbred line previously used for constructing a physical map and for genome sequencing) (McMullen et al., 2009). For the MAGIC lines, a set of 527 recombinant inbred lines (RILs) were developed by intercrossing a heterogeneous stock of 19 Arabidopsis thaliana accessions (Kover et al., 2009).
Various kinds of populations can be used for association mapping. Accessions collected from wild, gene bank collections, cultivars, and specialized populations (e.g., NAM, and MAGIC lines) are commonly used in plants.
Important Considerations
Linkage Disequilibrium (LD)
Linkage disequilibrium is the non-random co-segregation of alleles at two loci. During meiosis, recombinations shuffle genetic material between homologous chromosomes and cause LD to decay with increasing distance. There are multiple factors affecting LD in a crop. For example, LD generally decays faster in cross-pollinated crops compared to self-pollinated, diverse populations compared to populations with narrow genetic background. Also, different genes and genomic regions in the same crop can exhibit different rates of LD decay.
In the context of association mapping, the extent of LD decay defines the number of markers needed to conduct association mapping analysis and the expected resolution of identified associations. In self-pollinated crops where LD extends hundreds of kilobases, association mapping will have lower resolution, that is, a marker showing significant association could be far away from the actual mutation affecting the phenotype. In cross-pollinated crops where LD decays within few hundred base pairs, association mapping will have high resolution, that is, any marker showing significant association will be very close, or within the gene affecting the trait.
Population Structure
A population is structured if individuals of the population do not mate at random, or, in other words, if they deviate from Hardy Weinberg equilibrium. There are many methods used to identify if there is any structure/grouping in a population intended for association mapping analysis. Popular ways to estimate population structure are: a) Distance based phylogenetic methods b) Bayesian phylogenetic methods (e.g. using STRUCTURE software); c) Principal component analysis. The presence of structure can result in an elevated false-positive rate (spurious associations). In association mapping analysis, the estimates of population structure are used to account for effects due to grouping.
Kinship
Kinship or relatedness is estimated by the “coefficient of relatedness”, which is defined as the probability that the alleles of a locus chosen at random from two individuals are identical by descent. More details about estimation of kinship are in the article “Creating a Kinship Matrix Using Microsatellite Analyzer (MSA) Tutorial“. Kinship or relatedness can have a similar effect as population structure on association mapping analysis i.e., identification of spurious associations. In association mapping analysis, a matrix showing the relationship of all individuals of the association mapping population is used to account for effects due to kinship.
Approaches
Candidate Gene Association Mapping
In candidate gene based association mapping, the candidate genes to be included in the analysis are based on prior knowledge, expert opinion, and linkage mapping results for the trait of interest. Only markers in candidate genes are required to perform candidate gene based association mapping analysis. For example, in a candidate gene based association mapping study, Ehrenreich et al. (2009) identified between 2 and 10 genes significantly associated with flowering time in A. thaliana.
Genome-wide Association Mapping
This mapping approach involves scanning the entire genome of the species to identify significant associations. Compared to candidate gene based association mapping, it requires a high density of markers (depending on both genome size and LD decay), covering the whole genome within the LD decay of the crop. Recently, Tian et al., (2011), identified some of the key genes involved in important leaf architecture traits through a genome-wide association study in maize.
Significance Threshold
A threshold is set to declare significant associations. The two statistical methods commonly used to correct for multiple comparisons are a) False Discovery Rate (FDR) and b) Bonferroni correction. The correction is needed whenever one would like to test multiple hypotheses simultaneously. FDR controls the expected proportion of false positives among significant results by determining a threshold from the observed p-value distribution in the data, whereas Bonferroni corrections control the chance of any false positives. For further reading see Benjamini and Hochberg (1995).
Outline of Association Mapping
The following figure from Zhu et al. (2008) depicts steps for association mapping.
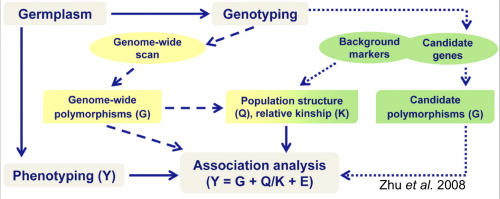
Figure 1. Steps involved in conducting an association mapping study. Figure Credit: Zhu et al, 2008. Reprinted with permission from ASA-SSSA-CSSA.
- Learning modules that discuss linkage disequilibrium and association analysis in forest trees
Tutorial
This tutorial walks the user through association analysis using TASSEL Version 3.0 (Bradbury et al, 2007); free software most frequently used for analysis in plants. At the bottom of this page, the files used in the tutorial are available to download for practice by the users.
See below for attached PDF version of this presentation.
References Cited
- Bradbury, P. J., Z. Zhang, D. E. Kroon, T. M. Casstevens, Y. Ramdoss and E. S. Buckler. 2007. TASSEL: Software for association mapping of complex traits in diverse samples. Bioinformatics 23:2633–2635. Available online at: http://dx.doi.org/10.1093/bioinformatics/btm308 (verified 7 Feb 2012).
- Benjamini, Y., and Y. Hochberg. 1995. Journal of the Royal Statistical Society. Series B (Methodological) 57:289–300. Available online at: http://www.jstor.org/stable/2346101 (verified 9 Feb 2012).
- Ehrenreich, I. M., Y. Hanzawa, L. Chou, J. L. Roe, P. X. Kover, and M. D. Purugganan. 2009. Candidate gene association mapping of arabidopsis flowering time. Genetics 183: 325-335. Available online at: http://dx.doi.org/10.1534/genetics.109.105189 (verified 9 Feb 2012).
- Kover, P. X., W. Valdar, J. Trakalo, N. Scarcelli, I. M. Ehrenreich, M. D. Purugganan, et al. 2009. A multiparent advanced generation inter-cross to fine-map quantitative traits in Arabidopsis thaliana. Public Library of Science Genetics 5:e1000551. Available online at: http://dx.doi.org/10.1371/journal.pgen.1000551 (verified 7 Feb 2012).
- McMullen, M. D., S. Kresovich, H. Sanchez Villeda, P. Bradbury, H. Li, Q. Sun, et al. 2009. Genetic properties of the maize nested association mapping population. Science 325: 737-740. Available online at: http://dx.doi.org/10.1126/science.1174320 (verified 9 Feb 2012).
- Tian, F., P. J. Bradbury, P. J. Brown, H. Hung, Q. Sun, S. Flint-Garcia, et al. 2011. Genome-wide association study of leaf architecture in the maize nested association mapping population. Nature Genetics 43:159–162. Available online at: http://dx.doi.org/doi:10.1038/ng.746 (verified 9 Feb 2012).
- Zhu, C., M. Gore, E. S. Buckler, and J. Yu. 2008. Status and prospects of association mapping in plants. Plant Genome 1:5–20. Available online at: http://dx.doi.org/10.3835/plantgenome2008.02.0089 (verified 7 Feb 2012).
Additional Resources
- Khan, M.A. and S. Korban. 2012. Association mapping in forest trees and fruit crops. Journal of Experimental Botany. Available online at: http://dx.doi.org/10.1093/jxb/ers105 (verified 20 Apr 2012).
- Myles, S., J. Peiffer, P. J. Brown, E. Ersoz, Z. Zhang, D. E. Costich, and E. S. Buckler. 2009. Association mapping: Critical considerations shift from genotyping to experimental design. Plant Cell 21:2194-2202. Available online at: http://dx.doi.org/10.1105/tpc.109.068437 (verified 7 Feb 2012).
- Oraguzie, N. C., E.H.A. Rikkerink, S. E. Gardine, and H. N. de Silva (eds.) 2007. Association mapping in plants. Springer, NY.
Funding Statement
Development of this page was supported by the United States Department of Agriculture (USDA), National Institute of Food and Agriculture (NIFA), the Specialty Crop Research Initiative (SCRI), Agreement 2009-51181-06023 and funding from the Bill & Melinda Gates Foundation for the CNAP Artemisia Research Project at the University of York, UK. Any opinions, findings, conclusions, or recommendations expressed in this publication are those of the author(s) and do not necessarily reflect the view of the United States Department of Agriculture or the Bill & Melinda Gates Foundation.
Attachments:
Marker data 499.txt (1.14 MB)
Trait 499.txt (10.11 KB)
Population structure 499.txt (9.34 KB)
Kinship 499.txt (1.06 MB)
PBGworks 1297