
Author:
M. Awais Khan, University of Illinois, Urbana-Champaign
Introduction
Linkage disequilibrium (LD) is the non-random co-segregation of alleles at two or more loci. In other words, it is the difference between observed and expected allelic frequencies (assuming random distribution due to independent assortment). This non-random co-segregation could be between loci on the same chromosome or between loci on different chromosomes. During prophase I of meiotic cell division, recombination tends to shuffle genetic material between chromosomes resulting in the decay of LD. As a result, after many meiotic events, only loci tightly linked to a functional mutation will show significant association with the trait of interest (Fig. 1).
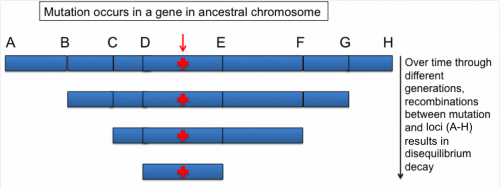
Figure 1. A segment of ancestral chromosome showing eight loci (letters) in linear order along with a gene showing a mutation (indicated by red arrow). It further illustrates the linkage disequilibrium decay between the loci and the gene over time that results from recombinations. Figure Credit: M. Awais Khan, University of Illinois, Urbana-Champaign.
LD can differ greatly, extending from a few hundred base pairs to kilobases, between different crops, as well as different genomic regions and genes within a crop. The following processes can affect the random assortment of alleles and thus LD:
- Natural Selection
- Mutation
- Non-random Mating
- Gene Flow
- Population Size
LD measurements
There are various measurements used to estimate LD including D, Lewontin’s (D’) and coefficient of correlation (r2). Details of the equations and calculations for each method of LD estimation and a test of significance for LD are presented in the following slideshow.
See below for attached PDF version of this presentation.
Tutorial
For the tutorial, the extent of LD is estimated in one gene named as “GAS”. First, the gene was sequenced in multiple (diverse) genotypes. The sequences of the gene obtained from all genotypes were compared to find single nucleotide polymorphisms (SNPs).
In the sequence of “GAS” below (Fig. 2), five letters in red font represent the SNPs. One can also count the number of nucleotide bases to find the exact distance (bp) between SNPs.
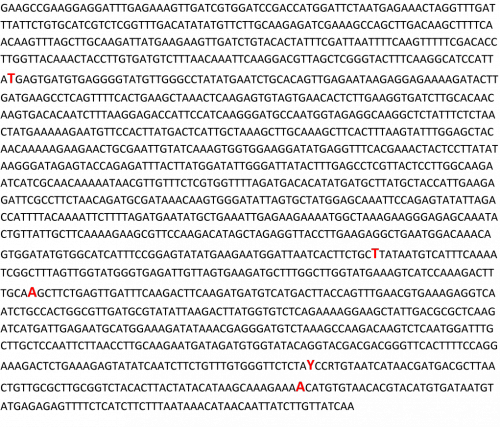
Figure 2. Nucleotide sequence of a gene named “GAS”. Five letters in red font represent SNPs in the gene, identified by comparing sequence of this gene among a set of diverse genotypes. Figure Credit: M. Awais Khan, University of Illinois, Urbana-Champaign.
After identification of SNPs in the gene, SNPs were genotyped in a large population to study LD. Although a large number of genotyping platforms are available, in principle, the marker could be scored on an agarose gel. genotyping method described in “Genotyping with Molecular Markers: Scoring a Molecular Marker on an Agarose Gel” could be used. For the genotypic data used in this tutorial, see the attached excel file which shows position (bp) of each of five SNPs with corresponding genotypic data for 530 genotypes, where “A” is homozygous for one allele, “H” is heterozygous, “B” is homozygous for other allele and “U” is missing data.
From here onward follow the powerpoint presentation below to see how to use genotypic data in the attached excel file for the “GAS” gene to estimate LD using GGT2 software.
See below for attached PDF version of this presentation.
Additional Resources
Falconer, D. S., and TFC Mackay. 1996. Introduction to Quantitative Genetics 4th ed. Harlow, Essex, UK: Addison Wesley Longman.
Lewontin, R. C. 1964. “The interaction of selection and linkage. I. General considerations; heterotic models”. Genetics 49(1): 49–67.
Weir, B. S. 1996. Genetic Data Analysis II. Sinauer Associates, Sunderland, MA.
van Berloo, R. 2008. GGT 2.0: versatile software for visualization and analysis of genetic data. Journal of Heredity. 99(2): 232–236. (Available online at: http://dx.doi.org/10.1093/jhered/esm109) (verified 5 Dec 2011).
Funding Statement
Development of this page was supported by the United States Department of Agriculture (USDA), National Institute of Food and Agriculture (NIFA), the Specialty Crop Research Initiative (SCRI), Agreement 2009-51181-06023. Any opinions, findings, conclusions, or recommendations expressed in this publication are those of the author(s) and do not necessarily reflect the view of the United States Department of Agriculture.
Attachments:
Genotypic data for LD tutorial in GGT.xlsx (28.33 KB)
measures_of_linkage_disequilibrium.pdf (209.69 KB)
estimation_of_ld.pdf (1.32 MB)
PBGworks 1258