
Author:
David M. Francis, The Ohio State University
Introduction
Allele-specific primer extension (ASPE) can be used to assay DNA sequence variation (SNPs) using the Luminex or Illumina Golden Gate assay.
The Luminex and BeadXpress collect data as mean fluoresence or pixels. The Australian Centre for Comparative Genomics provides a diagram and explanation of the Luminex allele-specific primer extension (ASPE) assay. The Illumina website provides a diagram and explanation of the Golden Gate assay.
Luminex ASPE data files
With ASPE genotyping using the Luminex, relative mean fluorescence or pixels are interpreted as alleles. There are four different worksheets in the ouptput file (Fig.1, Fig. 2, Fig. 3, Fig. 4).
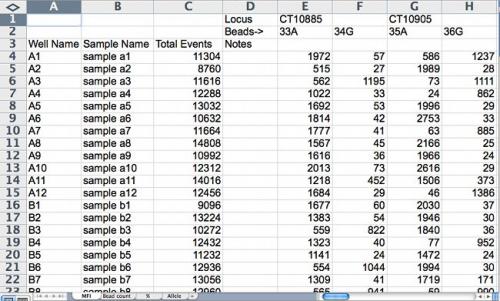
Figure 1. Spreadsheet of mean fluorescence intensity (MFI) of labeled nucleotides. For allele calling, if an intensity signal of either allele is less than 70 it is considered background, not a true signal; if greater than 70 but less than 100, it is not a very strong signal, but can be accepted for allele calling; if greater than 100, it is considered a quality signal. Screenshot credit: Heather Merk, The Ohio State University.
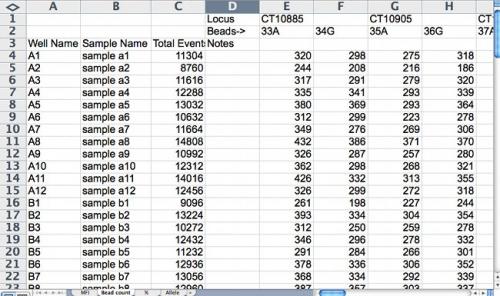
Figure 2. Sample bead count spreadsheet. For quality control, bead count should be more than 100 and be similar between the two beads used to represent a bi-allelic SNP marker. Screenshot credit: Heather Merk, The Ohio State University.
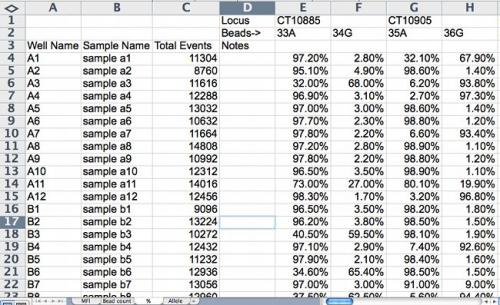
Figure 3. Percent data for allele calling is calculated by the following formula: ((intensity signal of allele 1 or allele 2)/(total intensity signal from both allele 1 and allele 2)) x 100. Screenshot credit: Heather Merk, The Ohio State University.
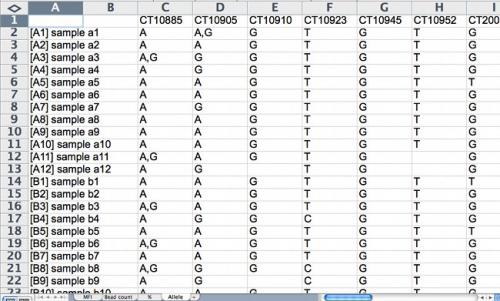
Figure 4. The allele calling is based on % data. The default cut-off is 75%. For example, if allele 1 has 76% of total intensity signal and allele 2 has 24%, allele 1 will be called. If allele 1 has 75% and allele 2 has 25%, it is scored as heterozygous. One must be cautious with automatic allele calling (is the first case really different from the second case?). Quality control standards are essential. For example, if the data are based on a survey of inbred varieties, and a marker is frequently scored as a heterozygote, data should be inspected and default cut-offs adjusted. Likewise, segregating populations should be inspected for expected segregation ratios using a Chi-square test. Screenshot credit: Heather Merk, The Ohio State University.
External Links
- Golden gate genotyping assay [Online]. Illumina. Available at: http://www.illumina.com/technology/goldengate_genotyping_assay.ilmn (verified 01 Mar 2012).
- The “FlexMAP microsphere”-based ASPE assay on the Luminex platform [Online]. GENica, Centre for Comparative Genomics. Available at: http://www.genica.net.au/index.php/The_%22FlexMAP_microsphere%22-based_ASPE_assay_on_the_Luminex_platform (verified 01 Mar 2012).
Additional Resources
For a further introduction to molecular markers, see Chapter 3 (p. 45–83), Introduction to Genomics, in:
- Liu, B. H. 1998. Statistical genomics: Linkage, mapping, and QTL analysis. CRC Press, Boca Raton, FL.
For an introduction to molecular markers, linkage mapping, QTL analysis, and marker-assisted selection written for professional plant breeders, see:
- Collard, B.C.Y., M.Z.Z. Jaufer, J. B. Brouwer, and E.C.K. Pang. 2005. An introduction to markers, quantitative trait locus (QTL) mapping and marker-assisted selection for crop improvement: The basic concepts. Euphytica 142: 169–196. (Available online at: http://dx.doi.org/10.1007/s10681-005-1681-5) (verified 01 Mar 2012).
For further information relevant to allele specific primer extension, see:
- Lee, S. H., D. R. Walker, P. B. Cregan, and H. R. Boerma. 2004. Comparison of four flow cytometric SNP detection assays and their use in plant improvement. Theoretical and Applied Genetics 110: 167–174. (Available online at: http://dx.doi.org/10.1007/s00122-004-1827-1) (verified 01 Mar 2012).
Funding Statement
Development of this lesson was supported in part by the National Institute of Food and Agriculture (NIFA) Solanaceae Coordinated Agricultural Project, agreement 2009-85606-05673, administered by Michigan State University. Any opinions, findings, conclusions, or recommendations expressed in this publication are those of the author(s) and do not necessarily reflect the view of the United States Department of Agriculture.
Mention of specific companies is for informational purposes and is not intended for promotion.
PBGworks 885