
These tutorials provide an introduction to association genetics and QTL mapping as well as different analytical approaches.
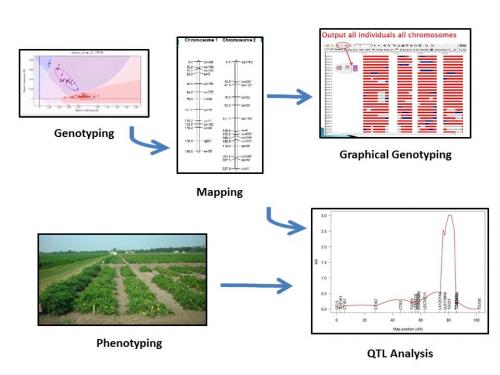
(Figure 1) Flow of information from collecting genotypic and phenotypic data to mapping to graphical genotyping and quantitative trait locus analysis. Figure credit: Heather Merk. Image credits: Genotyping, Allen Van Deynze, UC Davis; Mapping, Scott Wolfe, The Ohio State University; Graphical Genotyping, Nancy Huarachi, The Ohio State University; Phenotyping, David Francis, The Ohio State University; QTL Analysis, Hamid Ashrafi, UC Davis.
Introduction to Association Genetics
Mapping and QTL Analysis
PBGworks 1563