
PBGworks T203,76
PBGworks T203,76
Author:
David M. Francis, The Ohio State University
The Horsfall–Barratt scale (Table 1) is used for the visual assessment of plant disease on a semi-quantitative scale. The scale is designed to compensate for human error in interpretation of the percentage of foliage infected. Small differences are easier to discriminate at the extremes of the scale, so the range of values for low infection and high infection percentages are narrow. In the middle of the scale, where it is more difficult to assess small differences, the range is larger.
| Rating | % Infection | Range |
|---|---|---|
| 1 | 0 | 0 |
| 2 | 0–3 | 3 |
| 3 | 3–6 | 3 |
| 4 | 6–12 | 6 |
| 5 | 12–25 | 13 |
| 6 | 25–50 | 25 |
| 7 | 50–75 | 25 |
| 8 | 75–87 | 12 |
| 9 | 87–94 | 7 |
| 10 | 94–97 | 3 |
| 11 | 97–100 | 3 |
| 12 | 100 | 0 |
Development of this lesson was supported in part by the National Institute of Food and Agriculture (NIFA) Solanaceae Coordinated Agricultural Project, agreement 2009-85606-05673, administered by Michigan State University. Any opinions, findings, conclusions, or recommendations expressed in this publication are those of the author(s) and do not necessarily reflect the view of the United States Department of Agriculture.
PBGworks 718
Authors:
Kimberly J. Felcher, Michigan State University; David Douches, Michigan State University
To give an example of how a molecular marker can be used in a potato breeding program.
Potato breeding programs evaluate and select for numerous traits driven by end-use (fresh-market, chip processing, frozen/french fry processing, novelty), consumer preferences (skin color, flesh color, shape, culinary quality), and production requirements (yield, maturity, disease resistance). For a new cultivar to be successful it must combine as many of the desired traits as possible. For example, a new potato chip cultivar must meet grower demands (high yield, disease resistant, early maturing) and processor demands (high specific gravity, low levels of reducing sugars, smooth/round shape). The selection process occurs over multiple locations; includes field, greenhouse, and laboratory assessments; and requires 10–15 years from the initial cross to the release of a new variety. Furthermore, because trait demands can change over the short-term and the long-term, breeders must maintain and develop a germplasm pool with high frequencies of genes for desirable traits. One way to increase the efficiency of the breeding/selection process is marker-assisted selection (MAS). While many marker/trait association studies have been conducted in potato, only a few of these markers are being used for MAS due to cost, population specificity, linkage distance, and the amount of trait variation the markers account for. One marker with practical application for potato breeding is the RYSC3 marker for potato virus Y (PVY) resistance.
PVY is a member of the Potyvirus group that can reduce potato yield and quality. It is a particular problem for seed production as it can cause the rejection of seed lots in certification programs. Several genes for PVY resistance have been identified in wild species and introgressed into the cultivated potato. These include: Ryadg from Solanum tuberosum ssp. andigena (Kasai et al., 2000), Rysto from Solanum stoloniferum (Brigneti et al., 1997), and Ry-fsto from Solanum stoloniferum (Flis et al., 2005). The Ryadg gene confers extreme resistance to PVY and co-segregates with the PCR-based, SCAR marker RYSC3 (Kasai et al., 2000). This marker is suitable for MAS for several reasons: it co-segregates with the trait (PVY resistance), it requires the use of very little DNA, it is easily scored (presence/absence of a single band), it takes only a few hours to use, thus many samples can be analyzed per day, and the cost per sample is relatively low. Furthermore, an extensive study by Whitworth et al. (2009) demonstrated that the RYSC3 marker could identify clones with resistance to all PVY strains that are present in North America.
Potato breeding can best be described as pedigree breeding where phenotypic selection (based primarily on maturity, tuber appearance, and yield) is done at the F1 generation (year 1/single hill selections) and the genotype is then fixed due to clonal propagation. Selection continues over several years to find clones with the desired combination of traits (tuber quality, disease resistance, processing quality, increased nutritional value). These are traits that require larger plot sizes, more replications, and testing in multiple environments for accurate characterization. It isn’t feasible, due to cost and time constraints, to test several thousand, single-hill selections for PVY resistance in inoculated greenhouse studies. A more cost effective option is to make year 1 selections, where > 90% of the progeny are discarded, and then identify PVY-resistant progeny with the RYSC3 marker. However, only clones whose pedigrees indicate the potential for the presence of the Ryadg gene are subjected to MAS using the RYSC3 marker. Because PVY resistance is important but not necessary for the success of a new variety, the presence of the RYSC3 marker does not guarantee the advancement of a clone at this stage. However, the information is documented and may influence the selection process at later generations or the choice of parents to include in future crosses. Those clones that have the RYSC3 marker at the advanced breeding line stage are phenotyped for PVY resistance prior to commercialization.
Template DNA is extracted from leaf tissue that is collected from F1 plants growing in the field or from post-harvest tuber tissue. A high-throughput, 96-well, DNA extraction protocol is used to increase the efficiency and cost effectiveness of the process. Following PCR, using the template DNA and the RYSC3 primers designed by Kasai et al (2000), and electrophoretic separation, the individual clones are scored for the presence or absence of the 321 bp band that is linked to PVY resistance (Ryadg) (Fig. 1).
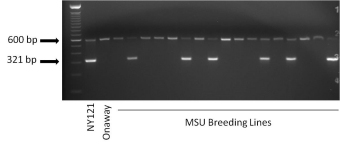
Figure 1. Example of a gel showing the presence or absence of the RYSC3 marker. Lines with a 321 bp band (such as NY121, a positive control known to have the Ryadg gene) are RYSC3 positive and lines lacking the band (such as Onaway, a negative control known to lack the Ryadg gene) are RYSC3-negative. The 600 bp band that is present in all lanes is an internal control used to verify that the PCR reaction worked properly. Photo credit: Dan Zarka, Michigan State University Potato Breeding and Genetics Program.
Advanced clones that have commercial potential and are RYSC3 positive are evaluated for PVY resistance via manual inoculations of multiple PVY strains (PVY0, PVYNTN, PVYN:0) followed by ELISA testing (Whitworth et al., 2009).
Although MAS is not widely used in potato breeding at present, the RYSC3 marker is a practical example of how MAS can be beneficial for the development of new varieties and enhanced breeding populations. As our knowledge of the potato genome grows and more genes are identified and linked to important traits, MAS will almost certainly become an increasingly important tool used by potato breeders.
Development of this article was supported in part by the National Institute of Food and Agriculture (NIFA) Solanaceae Coordinated Agricultural Project, agreement 2009-85606-05673, administered by Michigan State University. Any opinions, findings, conclusions, or recommendations expressed in this publication are those of the author and do not necessarily reflect the view of the United States Department of Agriculture.
PBGworks 882
PBGworks T199
PBGworks T203,79
Authors:
Allen Van Deynze, University of California, Davis; Shawn Yarnes, University of California, Davis

Image Credit: The Seed Biotechnology Center at UC Davis.
This page summarizes germplasm information that was developed by the Seed Biotechnology Center at UC Davis for SeedQuest and aggregated for eXtension.
Germplasm is a collection of individual plants that contains a species’ genetic variation. It can be represented and propagated by any living propagule such as seeds, cuttings, or even cells. Germplasm is the basis of plant breeding programs. It is usually limited to any sexually compatible species for a given crop. For more information, see germplasm.
Bioinformatics is the science of using information technologies to answer biological questions from enormous data sets, like those created by genome sequencing. Bioinformaticians develop computer databases and use statistical techniques to manage and analyze biological data. Bioinformatic tools, like those found at the National Center for Biotechnology Information, make it possible to search and compare vast amounts of genetic and biochemical data. For more information, see bioinformatics.
Genotyping is the process of determining the genetic makeup of individuals. Genotype can refer to the genetic makeup of a single location in the genome, multiple locations in the genome, or the sequence of the entire genome. Genotyping has many uses in plant breeding, such as the ability to test seedlings for the presence of genes involved in disease resistance. Genotyping also allows breeders to quickly determine if a plant is true-breeding, or homozygous, for important genes. For more information, see genotyping.
Induced mutations are created when plant DNA is exposed to mutagenizing agents that alter the DNA sequence. Naturally occurring DNA mutations are the source of all variation between organisms. Plant breeders looking for new sources of genetic variation in crop plants can induce mutations to generate artificial variation. For more information, see induced mutation.
Phenomics is the study of a plant’s phenome, the collection of all its traits, or phenotypes. Phenotypes are influenced by genetics (genotypes) and environmental conditions. As the process of genotyping plants has become simplified, there is much interest in developing methods to measure diverse plant phenotypes. For more information, see phenomics.
Proteomics is the study of a plant’s proteome, the collection of all its proteins. The structure of protein molecules is determined by an individual’s genotype and represents the heritable portion of a plant’s phenotype. However, unlike the plant’s genome, proteins interact directly with the environment. The composition and activity of the proteome changes in response to environmental cues. For more information, see proteomics.
A wild species is evolutionarily related to a cultivated plant species, and may represent the ancestral population of the cultivated species. Wild species are generally more genetically diverse than their cultivated relatives. Wild plant populations are adapted to living in a range of environmental conditions, as opposed to cultivated species that are adapted to more stable agricultural conditions. Plant breeders often use wild species to introduce new sources of genetic variation into their cultivated relatives. For more information, see wild species.
Development of this page was supported in part by the National Institute of Food and Agriculture (NIFA) Solanaceae Coordinated Agricultural Project, agreement 2009-85606-05673, administered by Michigan State University. Any opinions, findings, conclusions, or recommendations expressed in this publication are those of the author(s) and do not necessarily reflect the view of the United States Department of Agriculture.
PBGworks 724
Author:
David M. Francis, The Ohio State University
Current methods used to assay molecular markers include:
For a further introduction to molecular markers, see Chapter 3 (p. 45–83), Introduction to Genomics, in:
For an introduction to molecular markers, linkage mapping, QTL analysis, and marker-assisted selection written for professional plant breeders, see:
For further information relevant to allele specific primer extension, see:
Development of this lesson was supported in part by the National Institute of Food and Agriculture (NIFA) Solanaceae Coordinated Agricultural Project, agreement 2009-85606-05673, administered by Michigan State University. Any opinions, findings, conclusions, or recommendations expressed in this publication are those of the author(s) and do not necessarily reflect the view of the United States Department of Agriculture.
Mention of specific companies is for informational purposes and is not intended for promotion.
PBGworks 881
PBGworks T205,79
PBGworks T203,75
Author:
Heather L. Merk, The Ohio State University
The Kruskal–Wallis statistic, H, can be used in a plant breeding context to identify associations between molecular markers and traits, particularly when the population structure is unbalanced. The Kruskal–Wallis statistic is an alternative to ANOVA, which requires that populations meet statistical assumptions such as the population being normally distributed and the population variances being equal. Although the Kruskal–Wallis test does not require these assumptions, it is assumed that samples from each group (each genotype in this case) are independent and come from distributions with the same shape. The fact that the Kruskal–Wallis test uses ranks rather than raw data allows it to be used for most data that can be ordered.
For example, the Kruskal–Wallis test was used in the Marker-Assisted Selection for Disease Resistance in Tomato Tutorial to test whether or not each molecular marker genotyped in an inbred backcross (IBC) population was associated with bacterial spot resistance (ranked according to the presence or absence of the hypersensitive disease response).
When calculating H for single marker analysis, the null hypothesis tested is that the median phenotypic value for each genotype is equal. In the bacterial spot example, the null hypothesis is that there is no difference in disease response between the heterozygous individuals and the homozygous individuals.
The procedure for calculating H is based on Kruskal and Wallis (1952) and Clewer and Scarisbrick (2001).
First, the individuals should be ranked from lowest to highest phenotypic value, regardless of group (genotype). If individuals are tied, all those individuals should receive their average rank (e.g., if the third, fourth, and fifth lowest individuals were tied, they would each receive a rank of 4).
Second, H is calculated using the following equation:
where k is the total number of groups (genotypes), n is the number of samples, and Ri is the sum of the ranks for group i.
Provided that all groups have five individuals or more, H shares approximately the same distribution as chi-square with k-1 degrees of freedom. Thus, the chi-square distribution is consulted to assess whether or not to accept or reject the null hypothesis that phenotypic values do not differ between genotypes.
The “NPAR1WAY” procedure is used to perform the Kruskal-Wallis test in SAS. The class parameter is used for marker genotypes and the var parameter is used for the phenotypic value or rank.
Development of this page was supported in part by the National Institute of Food and Agriculture (NIFA) Solanaceae Coordinated Agricultural Project, agreement 2009-85606-05673, administered by Michigan State University. Any opinions, findings, conclusions, or recommendations expressed in this publication are those of the author(s) and do not necessarily reflect the view of the United States Department of Agriculture.
PBGworks 857
![H = [12/(N(N+1)] SUM[Ri**2/Ni] - 3(N+1)](http://www.itl.nist.gov/div898/software/dataplot/refman1/auxillar/eqns/kruskwal.gif)